- Regular article
- Open access
- Published:
Understanding the predictability of user demographics from cyber-physical-social behaviours in indoor retail spaces
EPJ Data Science volume 7, Article number: 1 (2018)
Abstract
Understanding the association between customer demographics and behaviour is critical for operators of indoor retail spaces. This study explores such an association based on a combined understanding of customer Cyber (online), Physical, and (some aspects of) Social (CPS) behaviour, at the conjunction of corresponding CPS spaces. We combine the results of a traditional questionnaire with large-scale WiFi access logs, which capture customer cyber and physical behaviour. We investigate the predictability of user demographics based on CPS behaviors captured from both sources. We find (1) strong correlations between users’ demographics and their CPS behaviors; (2) log-recorded cyber-physical behavior reflects well data captured in the corresponding questionnaire; (3) different CPS behaviors contribute differently to the predictability of demographic attributes; and (4) the predictability of user demographics from logs is comparable to questionnaire-based data. As such, our study provides strong support for demographic studies based on large-scale logs data capture.
1 Introduction
Traditionally, companies collect demographic and behavioral data from customers through questionnaire based studies, which are drawn from small population samples [1]. The operators of large indoor environments such as shopping malls, airports, university buildings and hospitals are seeking a new understanding of how their buildings are being used by installing an information infrastructure (e.g., public WiFi, iBeacons), which allows the logging of customers’ physical movement and online activity.
Although vast logs of such activity are routinely captured, there is currently little or no understanding of how to predict behavior from the logs. We contend that such customer behavior has three distinct components: cyber (online browsing/searching activity in terms of frequency and Web content category), physical (movement in the environment), and social (who, if anyone, is accompanying). To date, the interaction between these three components has not been extensively studied. Indoor shopping malls are ideal for the investigation of CPS behavior: they have a structured well understood layout, and they are increasingly equipped with public WiFi networks enabling the capture of the cyber and physical movement behavior of thousands of users by logging their Web traffic and WiFi Access Point (AP) associations.
With access to a large log of such activity, one can ask the following research questions:
-
RQ1: Does users’ demographics correlate with their CPS behaviors? If yes, what is the predictability of users’ demographics given their CPS behaviors?
-
RQ2: What is the degree to which the logs reveal users’ self-declared CPS behaviors?
-
RQ3: How do the log-based CPS behaviors perform in terms of demographic predictability, comparing with their self-declared counterparts?
We answer these research questions by comparing the outputs of a customer questionnaire against a large-scale log of customer activity. The questionnaire (547 responses, and only respondents above 18-year-old were allowed to participate) was conducted by the owners of a large inner city shopping mall in Sydney, Australia, who at the same time captured WiFi AP association logs of customers’ physical movements, and online activity. With both questionnaire responses and log content, we were able to comprehensively investigate the predictability of customer age, education level, income, parental status, and user type. We find (1) some significant positive correlation between users’ demographics and their physical/Web activities; (2) that WiFi/Web logs closely reveal user behaviors that were surveyed by the questionnaire; (3) that different CPS behaviors dominate the predictability of different demographics; (4) the log-based behavioral attributes perform comparably to customer self-declared features. As logs are collected at large-scale with low cost, this study contributes significantly to the practicality of predicting user demographics at large scales.
The contributions of the paper are as follows:
-
To the best of our knowledge, this is the first study to investigate the predictability of user demographics by considering CPS behaviors.
-
A comprehensive analysis of users’ CPS behaviors and their demographics.
-
We demonstrate the degree to which log-based CPS behaviors reveal users’ self-declared CPS behaviors.
-
The predictability of users demographics are examined and compared by using both self-declared CPS behaviors and log-based behaviors.
The paper is organized as follows: Section 2 presents the related work. Section 3 includes the questionnaire design and the logs extracted. Section 4 provides the analysis of the association between users’ demographics and their CPS behaviours. Section 5 shows the degree to which logs reveal users’ CPS behaviors. Section 6 examines the predictability of user demographics, and Section 7 concludes the paper.
2 Related work
We briefly review research on user demographic prediction from the aspect of data types that are recorded.
2.1 Cyber behavior
Much research on demographic prediction focuses on cyber behaviours investigate through Web pages browsed [2–5], queries issued [2, 6], mobile Apps installed, or Web contributed or commented upon (e.g., images, tweets, comments, likes) [7–9].
Murray and Durell [2] studied the problem of inferring demographics based on users Internet usage, including queries submitted and Web pages accessed. Although they experienced poor results, the researchers concluded that it is possible to infer anonymous Internet users’ demographics. Jones et al. [6] found that a sequence of queries can be mapped to demographics with a simple classifier. Bi et al [8] tried to enhance the predictability from query logs in terms of inferring user demographics. They found the accuracy of identifying ‘age’ and ‘gender’ are high. Hu et al. [3] inferred users’ age and gender from browsing behavior. They built a user-Web page bipartite graph by using the logs of a particular Web site, and applied smoothing techniques to overcome data sparseness, and found the proposed model achieves good performance in age and gender prediction. Kamvar and Baluja [10] studied users’ searching behaviour and the general category of Web content they click on Google’s mobile search interface. Kumar and Tomkins [11] studies users’ searching behaviour on Yahoo search engines and their browsing behaviour via a toolbar in Web browser. Goel et al. [4] conducted a large scale study of the correlation between users demographics and a Web content categories. The researchers found that browsing histories are a strong signal for inferring demographics. Li et al. [5] predicted user demographics from both unencrypted and encrypted Web traffic. They found that reasonable accuracy could be obtained predicting gender and education level.
Considering social media, Kosinski et al. [7] showed that Facebook likes can be used to accurately predict a wide range of personal attributes, including sexual orientation, ethnicity, religious and political views, personality traits, intelligence, happiness, parental separation, age, and gender. Filippova [12] showed that the comments users left on YouTube can be used to predict their gender.
You et al. [13] found it possible to predict gender from the images posted in online social networks. Culotta et al. [9] proposed a distant supervision method to inferring twitter use demographics by using audience measurement data from thousands of Websites. Together with textual content and the social network relationships, they produced good correlation across various demographic attributes. Finally, Seneviratne et al. [14] discovered that the mobile Apps installed on a person’s smartphone can be used to predict their gender.
2.2 Physical behavior
Predicting user demographic has been tried based on where users are [15], how they move [16], and what they do [17–20]. Zhong et al. [16] explored the problem of predicting user demographics, based on the data set of the third task of the Nokia Mobile Data Challence (MDC) [21], which includes users call logs, app logs, activity logs, media logs, and environment contexts. They proposed a contextual feature construction framework to extract a set of features to describe users, including temporal and movement behaviors, and found high accuracy can be obtained when using multi-task learning methods. Mohammady and Culotta [15] studied how to use county-level statistics to infer the demographics of Twitter users, and found that classifiers trained on county-level information can predict user-level attributes accurately. Wang et al. [17, 22] attempted to predict user demographics from a shopping purchase history. They proposed a multi-task representation neural model to learn a shared semantic representation across multiple prediction tasks. They found this multi-tasking learning method improved demographic prediction accuracy. Stach and Buhner [18] studied how to recognize the gender information based on users’ automotive driving data, and found that acceleration, gas pedal actuation and situation dependent driving speed are closely related to driver’s gender. James et al. [19] studied the differences in risk taking between male and female, and found that the differences on the majority of test tasks (e.g. smoking) are significantly different. Harris and Jenkins [20] further studied why women take fewer risks than man. Coluccia and Louse [23] studied the gender differences in spatial orientation, and men show better orientation performance than women.
2.3 Social behavior
There is some research utilizing an online social network to predict demographics, but there is little focusing on the social behavior in a physical grouping context, the focus of this paper. Mislove et al. [24] studied how the social relationship in social networks can be used to predict users’ college, year, and major finding a small fraction of training data with social network graph can lead to high accuracy. Dong et al. [25] studied how people’s social strategies can be discovered from their daily mobile communication, and then be further used to predict their demographics. They also found these social information can lead to high prediction accuracy in users’ age and gender. Culotta et al. [26] predicted Twitter users’ demographics based on whom they follow via a distantly labeled dataset by collecting audience measurement data for a large number of websites. They found this lead to competitive performance with a fully supervised method. Volkova and Bachrach [27] studied the problem from the aspect of neighbors in a social network. They specifically contrasted the emotions of a user’s neighbors in a social network, and found this contrast information was correlated with certain user demographic traits. Moreover, investigating the behaviour of individuals and their relationship in the physical space is also active in sociometric sensors, e.g. the SocioPatterns collaboration.Footnote 1 More recently, Sapiezynski [28] proposed a model to infer person-to-person proximity by using WiFi signals. Sekara and Lehmann [29] studied how to deploy the electronic datasets as a valid proxy for real life social interactions, and found that the strength of electronic signals can be used to distinguish between strong and weak friendship ties.
Some other information has been used to predict users’ demographics: predicting authors’ age and gender from their writing styles [30]; gender classification from videos analysis [31]; and gender/age estimation from images of faces [32, 33]. Due to the scope of this study, we will not detail existing research in this direction.
2.4 Gaps
In this paper, we present a methodology to derive demographic information about visitors to a constrained, indoor environment based on large-scale, indoor WiFi sensing data. Such data are available to indoor space operators and cover a large cross-section of the visitors. Previous studies [34–36] focused on more coarse spatio-temporal demographic sampling, usually covering extensive parts of cities and linking demographic information to social network check-ins and also cell-tower data, and given the higher sparsity of the data, the analysis are done on aggregate behaviours rather than modelling individual trajectories for prediction. The analysis of social media users is a distinct problem, with a highly biased population (users of twitter, Foursquare etc. are not evenly drawn from the general population). The predictions based on such data are usually coarse and the portability of these methods outside of countries with high Foursquare uptake is questionable. Recently, Goel et al. [4] also studied how to infer user demographic from users’ Web logs by treating it as binary classification problem, e.g. for users’ age, they got an accuracy of 0.8 with two coarse classes: <25 and >25 years old. In our study, we attempt fine grained classification, such as four classes for users’ age (18-24 years, 25-39 years, 40-54 years and >55 years). Finally, we contribute a perspective on how the users’ cyber, physical, and social behaviors combine to improve demographic prediction, a special focus of this paper.
3 Data acquisition & processing
The data used in this study were collected using a combination of a large-scale online questionnaire and the corresponding WiFi/Web logs of the questionnaire participants. Specifically, the log data were collected via a free opt-in WiFi network of the mall, where users must login to the system to use the WiFi. This login was used to link the survey data and the log data. The consent of tracking the users’ MAC addresses was obtained from users before logging into the WiFi system by the mall operator by accepting terms & conditions of using the WiFi network. The mall operator provided access only to anonymised data to researchers.
3.1 Questionnaire data
The online questionnaire was targeted at the registered customers of an inner city shopping mall in Sydney, Australia. The owners of the mall conducted the questionnaire online in November 2014. It was administered in English via email. The questionnaire was sent after the customers visited the mall. Overall, more than 10,000 customers were sent the questionnaire and offered a chance to enter a prize draw if they completed the questionnaire.Footnote 2 A total of 547 (5% completion rate) questionnaires were returned.
The questionnaire contained four sections:
Demographic Attributes collecting customers’ age, education, income, parental status, and user type, see Table 1 for more detail.
Web Attributes enquiring about customers’ use of the Web via the mall’s WiFi system, including estimates of time spent online (further, online duration), frequency of use, frequency of searching on the Web, and the categories of Web sites visited (based on definitions by Brightcloud).Footnote 3 See Table 2 for more detail.
Physical Attributes enquiring about customers’ physical activities in the mall, including visiting frequency and duration, common visiting days of week, and the most favored shop category (as defined by the operator of the mall). Note, these categories are different to those defined by Brightcloud. See Table 3 for more detail.
Social Attributes collecting information about the social grouping status of the visitors of the mall: coming alone, with child/children, with an adult, or in a group. See Table 4 for more detail.
3.2 Log data
The users tracked in the mall have opted-in to use the free public WiFi network provided by the mall operator. Users need to log in with their email address to instantiate a session and access the Internet. The sampling is done every 5 minutes on each Access Point (AP), and only the RSSI and history of online browsing and searching behaviours of devices connected to the AP are logged. The user’s device is only tracked when associated with an AP, and can only be associated with a single AP at a time. The precision of the indoor localisation has been analysed in our previous study [37]. Namely, two types of logs have been captured and studied: a WiFi Association Log (AL) capturing users’ physical movement, and a Web Browsing Log (BL) capturing users’ cyber activities.
3.2.1 Association log
The AL was collected from September 2012 to December 2014 via the free opt-in WiFi network of the mall, containing \(14\text{,}751\) records covering 3779 user (day) visits from all questionnaire participants. The log captured information about user physical behavior characterized by the following parameters: (1) user device’s MAC address uniquely identifying the associated device (information was hashed for anonymization); (2) the users’ IP address; (3) the ID of the WiFi AP that the user’s mobile device was connect to at a given point in time, used as a proxy for the user’s location; (4) the date of users’ association/disassociation with an AP; (5) the duration of users’ association with the AP.
To obtain the shop categories from logs that a user might like, floor plans of the mall were overlaid with AP positions and the service areas of the APs were approximated by Voronoi regions [38], each centered on a single AP, and encompassing the space closest to that AP. The regions were then manually rectified to better align with the frontages of physical stores in the mall (see [39] for details). Shop frontages are the main determinants of context as the WiFi network studied is designed to only cover common spaces of the mall. More details about the overlaying of floor maps with APs can be found in [40]. Thus, the shop categories covered by an AP is defined both by the shops covered within its signal coverage.
3.2.2 Browsing log
The BL contains \(30,208\) records covering 298 user/day visits of 83 questionnaire participants. The BL includes the users’ Web browsing behavior, characterized by: (1) the date of the Web request; (2) the users’ IP address; (3) the Web page requested, as defined by the URL and by the BrightCloud categorisation of the URL.
Queries to search engines were extracted from the BL, by identifying URL requests from search engines. Following [41], (1) we extracted the set of host names from the BL by analyzing all URL requests; (2) we identified the set of hosts relating to search services; (3) for each search service, we identified how queries were formatted in URL requests, and removed any auto-completion and auto-suggestions URLs at this step; (4) we extracted the final queries by using regular expressions and pattern-matching. In total, 345 queries were extracted, served by 15 search engines, including Google, Yahoo, searchmobileonline, Twitter, SMH (Australian Breaking News Headlines & World News Online), Ninemsn, Taobao, Amazon, a search engine of the mall’s own website, saksfifthavenue, Vogue, Ticketek, shuuemura-usa, Vodafone, and Macys.
4 Self-reported behaviors
We examine the relationship between users’ demographic attributes and their self-reported CPS behaviors that are captured by the questionnaire.
4.1 Tendencies in durations
We investigated the differences in the physical and online access duration across different demographics groups by age, education, income, parental status, and user type. Specifically, the physical duration is the duration of the visit in the mall (Table 3), and the online duration means the percentage of this visit spent online (Table 2).
The distribution of duration for each demographic group was found to generally follow a normal distribution. Based on this, we used an ANOVA test to examine whether different demographic groups present significant differences in physical/online mean duration (see Tables 2 and 3). All demographic groups show significantly different (specific) distributions, except for online duration by parental status and user type, see Table 5. We investigated the patterns in these behaviors and found that: (1) investigating the users by age, people under 55 tend to stay longer both in the mall and spend more time on the Web; (2) when stratifying by education, people with an honors degree tend to stay comparatively shorter both in the mall and on the Web; (3) by income, people earning over 180k tend to stay longer both in the mall and on the Web; (4) by parental status, people having kids tend to stay longer in the mall, but not on the Web; (5) by user type, Central Business District (CBD) workers tend to stay longer in the mall, but not on the Web. Overall, we observe the differences in physical visiting duration are likely larger than their counterparts in the online duration.
4.2 Tendencies by content categories
Next, we examined the correlation of demographic attributes with browsing/querying categories, physical shopping categories, and social grouping status.
First, we investigate the reported popularity of each content category (Web and Physical location categories), as well as social grouping favored by the visitors (Figure 1). Note, users may choose multiple categories for the corresponding questions in the questionnaire. It appears that: (1) mall visitors tend to browse for generic information (e.g. social network and communication) in the mall, but their search behavior is more targeted as they search for specific content (e.g. shopping, food & drink); (2) the popularity of physical and Web browsing categories is skewed towards distinctly different content; (3) people’s physical shopping behavior and Web browsing behavior dominate their querying behavior. (4) The majority (over 80%) of visitors come to the mall alone or with another adult, and less than 20% come with children or in a group.

(a) the distribution of the top 5 popular Web categories that users browsed; (b) the distribution of the top 5 popular Web categories that users queried using search engines; (c) the distribution of the top 5 popular shop categories that users physically visited.
Next, we consider the relationship between different demographic groups and physical/Web/social categories. We conduct a \(\chi^{2}\)-test to test for significant differences in category popularity across each group.Footnote 4 The detailed \(\chi^{2}\) values and p-value of the significant associations are shown in Table 6. The corresponding distributions are shown in Figure 2, where the horizontal axis indicates a user group and the vertical axis shows the probability of how many users in this group answer ‘yes’ to a particular question. For example, in Figure 2(a), the blue dashed line with * markers shows the probability of users that answered ‘yes’ to ‘Social Network (Browsing)’ question across 4 different user age groups.
-
Age: Five Web categories are significantly associated with age. As the age increases, popularity of social network decreases while News increases. Finance and Business show a similar trend to News, and Real Estate has a peak at the age group of 25-39 year old. For physical shop categories (Figure 2(b)), people’s interests in Jewelry decreases from younger to older respondents, while their interests in locations with shops categorised under the Children category peaks at age 25-39. The social dynamics of mall visits also change with age (Figure 2(c)). The likelihood that a user will visit With an Adult decreases with age. The 40-54 year-old age group tends to visit the mall With Kids, 18-24 and the 55+ year old users are comparatively more likely to visit With a Group.
Figure 2 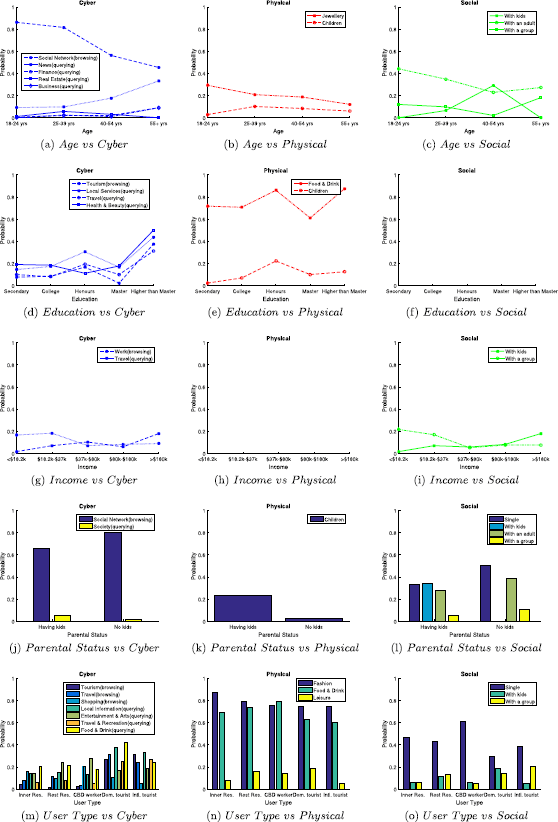
Significant associations of demographic attributes with CPS categories ( \(\pmb{\chi^{2}}\) -test).
-
Education: People with Higher than Master degree have significantly different interests to groups with lower education status (Figures 2(d) and 2(e)). The most popular categories of physical locations visited, content browsed and queryied are all different across education levels. Yet, there is no pattern in the social group status of the visits significantly associated with Education, thus Figure 2(f) is blank.
-
Income: Only two Web content categories are significantly associated with visitors stratified by Income (Figure 2(g)), although the change across groups is relatively small. Moreover, for social behaviours (Figure 2(i)), With Kids and With a Group show similar trends to Work and Travel in cyber categories, respectively. No physical shop category was significantly associated with Income, thus Figure 2(h) is left blank.
-
Parental Status: People Having Kids tend to browse less on Social Networks, and search more Society; perhaps unsurprisingly they significantly shop more a store selling things for Children than those with No Kids, see Figure 2(j) and 2(k). Those Having Kids have a higher probability of visiting the mall With Kids, and relatively lower probability of visiting with others or single.
-
User Type: For cyber categories (Figure 2(m)), Domestic and International tourists are more interested in Tourism, Travel, Local Information, Travel & Recreation and Food & Drink than the other groups. They are, however, also less interested in shopping. CBD worker visitors are more interested in Shopping and Entertainment & Arts, while the rest of Sydney resident are mostly interested in Entertainment & Arts and Food & Drink and the inner Sydney resident are more interested in Food & Drink and Shopping.
When it comes to interest in categories of physical shops (Figure 2(n)), it also appears that tourists (including domestic and international) are less interested in the Food & Drink shops, although they tend to search Food & Drink on the Web. Local residents (inner city residents and residents from rest of Sydney) show more interests in Fashion than CBD workers and tourists. Domestic tourists show the highest interests in Leisure, then followed by Rest of Sydney Resident, CBD Workers, Inner Sydney Resident and International Tourist.
While visiting the mall alone (Single) is popular across all user types (Figure 2(o)), CBD workers are the group most likely to visit the mall alone. Tourists (including domestic and international) are more likely to visit With a Group, but domestic tourist also tend to be accompanied by children. Rest of Sydney Resident also tend to visit with children or in a group, even compared to Inner Sydney Resident.

Overall, people’s demographics are significantly associated with their CPS behaviors. There are 10 content categories significantly associated with Age, 6 with Education, 4 with Income, 7 with Parental Status and 13 with User Type. This might indicate that Age and User Type are relatively easy to predict from their CPS behaviors, but Education, Income and Parental Status may be less strongly associated with content categories and hence be more difficult to predict. We will experimentaly investigate this in Section 6.
5 Logs vs. questionnaire
In this section, we examine how close the logs match their self-reported physical and Web behavior counterparts from the questionnaire. We do not consider the social status here, because as pointed out by [39], the accompanying status of the mall visitors is largely influenced by whether the accompanying peer has a mobile device that is registered to the mall’s free WiFi system.
5.1 Cyber-physical behaviors from logs
For measuring the correspondence of logs and questionnaire responses, we extracted the corresponding attributes from both the AL and BL.
The following physical attributes have been extracted from AL:
-
median(gaps): the median of the gaps (in days) between two consecutive visits of the same user are used to estimate the visiting frequency to the mall.
-
Weekdays occurrence: the number of occurrence of the days in a week when the user visit recorded in AL.
-
Time in AL: the total time the user are connected to the WiFi system.
-
Time@ShopCat: the time spent in each shop category.
The following Web attributes have been extracted from BL:
-
WiFi frequency: the ratio of the number of visits accessing the Web over the number of visits in AL.
-
# of queries: the number of issued queries, which are extracted manually from the log as described in Section 3.2.2.
-
URL Category: URLs are categorized using BrightCloud. We then compute the likelihood of accessing each category per user, to characterise what users browse online when visiting the mall.
-
Query Category: the category of the query click-through, categorized by BrightCloud.
In contrast to the self-reported questionnaire data, two attributes can not be extracted from the logs reliably: online duration and the noted social grouping status. For online duration, the reason is that the time parameter reported in BL only contains the date, not the hours, minutes and seconds. This makes it impossible to compute how long the user is active on the Web. Similarly, the social grouping status, cannot be studied as there is no guarantee that the accompanying survey participant will also use the opt-in WiFi system. The random sample of visitors does not allow for a reliable analysis of their social behavior.
5.2 Log behaviors vs. questionnaire behaviors
Here, we analyze how well the logs reflecting users’ self-declared behaviors from the questionnaire responses, by measuring how close the log-based attributes are to the corresponding questionnaire responses. As we observed two kinds of attribute values, numeric and categorical, we use different metrics to evaluate the association between them.
-
Mean Absolute Error (MAE) is used if both attributes are numeric.
$$ \frac{\vert v_{s} - v_{l} \vert }{n}, $$(1)where \(v_{s}\) denotes the value of self-declared questionnaire attribute, \(v_{l}\) denotes the corresponding attribute extracted from logs, n denotes the number of relevant data points, serving as a normalizing factor.
-
Mean Symmetric Difference (MSD) is used if both attributes are categorical. The Symmetric Difference set operation is applied on to measure the consistency between the two sets of attributes.
$$ \frac{\vert v_{s} \triangle v_{l} \vert }{n}. $$(2)In other words, MSD is the average value of the size of the symmetric difference of two sets.
-
Probability Distribution Examination (PDE): if one attribute is categorical and its counterpart is numeric, we examine the probability distribution of the numeric values against each categorical value, and visually inspect their closeness.
The compared self-declared questionnaire attributes (\(v_{s}\)), the corresponding log-based attributes (\(v_{l}\)), and the comparison results are shown in Table 7. The corresponding MAE and MSD results are small for all compared attributes, which indicates that the log-based attribute values are close to the values of the self-declared questionnaire attributes:
-
Physical Attributes
-
Frequency: The average difference between the user self-reported frequency and the one captured in logs is 0.88 days. For example, if a user reported s/he visited the mall on a weekly (7 days) basis, the log-observed frequency is between \(7-0.88\) and \(7+0.88\) days.
-
Weekdays: There are, on average, 2.13 visits that did not appear on the self-reported visiting days, and the average visits per participants to the mall is 12.05 times. Figure 3(a) shows the user self-declared visiting days in a week versus the corresponding values computed based on the logs. Taking Sunday on the self-declared axis as an example, users declaring that they visit the mall on Sundays are also most likely to be log-observed in the mall on Sundays. This means that the log recorded user visits faithfully capture the behaviour declared in the questionnaire.
Figure 3 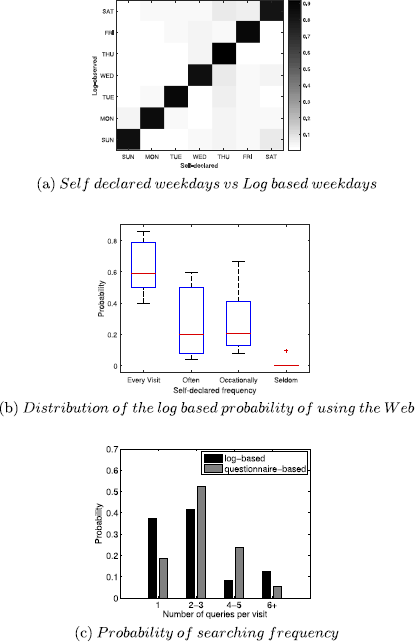
(a) The self-declared weekdays vs the log-based one, where the size of the circle denotes the probability of a log-based visit happened on a self-declared day; (b) The distribution of the log-based probability of using the Web for each self-declared frequency; (c) The self-declared searching frequency vs the log-based ones.
-
Duration: The average difference between the user self-reported visiting duration in the mall and the one captured in logs is 0.70 hours, while most of the users spend around 3.5 hours in the mall.
-
Interests: The average difference between the user self-reported favourite shop categories and the ones captured in logs is 2.50, while most of the users favour more than 10 shop categories out of 34 available ones.
-
-
Web Attributes
-
WiFI Frequency: Figure 3(b) shows the distribution of the log-based observations of Web use frequency (estimated with [42]) for each corresponding categorical values obtained in the questionnaire. We find that for Every Visit, the corresponding log values are averaged around 0.6 with the max 0.83 and the min 0.4, which is clearly higher than for the other groups; for Seldom, the corresponding log values are all zero except for a single outlier value (around 0.1); the corresponding values for Often and Occasionally are not well distinct to each other, which might be because of the ambiguity of the natural language expression used in the questionnaire.
-
How many searches: Figure 3(c) shows the probability of the number of issued queries based on the log and its corresponding category from the questionnaire. Note that while most of the users submitted 2 or 3 queries in a visit and correctly reported this, a large number of users underestimated the number of times they perform a single query and overestimated the occurrence of visits with more queries issued.
-
What to browse/search: The average difference between the user self-reported favourite Web browsing/searching content and the ones captured in logs is 1.66 and 1.65, respectively. However, they tend to search/browse overall 8 categories of Web contents.
-

Overall, log-based attribute values reasonably reflect the self-reported values. Logs also suffer less from biases of underestimation/overestimation of activities where capturing the exact frequency is hard if reporting occurs with a delay.
6 Predictability of demographics
We now focus on the predictability of user demographics from visitors CPS behaviors based on the responses to the questionnaire and/or based on data extracted from the logs. We investigate whether (1) log-based attributes perform comparably to their questionnaire counterparts; and (2) whether the CPS features contribute equally to the predictability of demographic attributes? Note, the focus is not on the accuracy of the predictions per-se, because (1) the number and granularity of questionnaire-based features we used are heavily limited by the length of the questionnaire, (2) only the log-based features that exactly match questionnaire-based features are part of this comparison.
6.1 Experiment configuration
Here, we formulate the predictability of user demographics as a classification problem. Consider the parental status as an example. There are two classes, having kids and no kids, and the responses/attributes describing users CPS behaviors are the features for each user. We apply Support Vector Machine (SVM) as the classification model, tested with 5-fold cross validation, and prediction accuracy as the measurement metric - the proportion of the correctly classified participants over all tested participants.
We examine the following combinations of CPS behavior attributes available from both the questionnaire responses and WiFi logs:
-
questionnaire-based attributes: (1) questionnaire-cyber: the Web attributes as shown in Table 2; (2) questionnaire-physical: the physical attributes as shown in Table 3; (3) questionnaire-social: the social grouping status as shown in Section 3.1; (4) questionnaire-all: includes all cyber, physical and social attributes.
-
Log-based attributes: (1) logs-cyber: the Web attributes extracted from BL as shown in Section 5.1; (2) logs-physical: the physical attributes extracted from AL as shown in Section 5.1; (3) logs-social: Nil; (4) logs-all: contains all attributes extracted from both AL and BL. In addition, we consider two sets of users here:
-
all users: all participants that participated in the questionnaire collection, but may or may not be also present in the logs;
-
cyber users: the sub-set of participants who have cyber browsing/searching logs associated with the questionnaire responses.
-
Note, for both questionnaire-based and logs-based cyber/physical behaviors, we do not know the Web content accessed, only the coarse category of the content. In other words, we know the category of the Web site, not the exact web site/page which may be distinct. Similarly, we know the category of the shops the users are interested in, not the names of the shops or the products they sell. This is different from other reviewed research (Section 2), in particular because this study focuses on users of a large heterogeneous mall, not of a single e-commerce site or a specific store.
We use two baselines for comparison of the accuracy of our predictions: mostPop always predicting an attribute of a user based on the demographic group for which this content is most popular, and a random model, predicting user class randomly.
6.2 Predicting demographics
Table 8 shows the accuracy of demographic prediction from questionnaire data, log data and baseline methods, and Table 9 shows the two-tailed paired t-test among these results. We find that (1) both questionnaire-based and log-based predictions significantly outperform random and mostPop baselines; (2) for both questionnaire-based and log-based features, the combination of all CPS features always significantly outperforms predictions based on features capturing a single category of behavior; (3) applied to all questionnaire participants, log-based features achieve comparable results to their questionnaire-based counterparts, although the log-based features do not cover the social behavior features. The reason for this might be that some of the log-based features contains more fine-grained information than their corresponding categorical counterparts in questionnaire data, e.g. WiFi usage frequency; (4) when classifying participants using cyber browsing/searching logs, the prediction accuracies significantly improve for all demographics except for parent status (see line (cyber-physical) cyber user of Table 8). Specifically, the accuracy of User Type prediction is boosted from 47.25% to 66.04%. In addition, this also indicates that capturing social grouping behaviors is necessary to predict parent status; (5) the ability to predict different demographic attributes varies. Figure 4 shows the improvement in prediction of demographic attributes based on either self-reported CPS features or logcaptured CPS features, compared with mostPop. For questionnaire-based features, the largest improvement is achieved on user type (35%), while the least improvement is obtained on education (5.1%); the improvement on the remaining demographic attributes, i.e., age, income and parent is similar, around 15%. This may indicates that while a visitors user type is relatively easy to predict, predicting attained education is hard, while remaining attributes are similarly predicatble. (6) the predictive capacity of individual CPS features differs by demographic group:
-
Age: while cyber features outperform physical and social features, the difference in predictive power based on accuracy is not large. Table 10 shows the top 5 best performing features. The top-5 features for predicting Age include two cyber, two physical and one social feature,
-
Education: appears to be the most difficult demographic attribute to predict, with an improvement of only around 5% compared to the mostPop baseline. Only a single feature (Work-Browsing) performs better than the mostPop baseline for the prediction of Education (Table 10). Recall the analysis in Section 4.2. Although people with higher than master degrees behave differently to others, all the other groups (by education) are not distinguishable, possibly with the exception of their association with the shopping category Children. This includes no association between social group status and education. This confirms our observation that the social feature performs roughly the same as the mostPop baseline.
-
Income: physical and cyber features significantly outperform social features when predicting Income. The top 5 best performing features in Table 10 include 1 physical feature and 4 cyber features, confirming that physical and cyber behaviors dominate the predictability of users’ income. Specifically, the most predictive physical feature is duration, which confirms the analysis in Section 4.1.
-
Parent: This attribute is relatively easier to predict, compared to Age, Education and Income, but not User Type. It is clear that social feature dominates the prediction performance, and significantly outperforms the cyber feature. As shown in Table 10, this is mainly because of the WithKids social group status. In addition, the physical, self-reported feature Children is also a good (and expected) indicator for users’ parental status. Logs-based features perform badly here, simply because they lack the social information.
-
User Type: This is the most easily predicted demographic, with a 35% improvement when comparing with mostPop. From results of questionnaire-based features, we observe physial features dominate here. The top performing features are physical visiting frequency and time (days in a week), as shown in Table 10.

The improvement of CPS features when comparing with mostPop .
7 Conclusion
In this paper, we investigate the predictability of user demographics based on the understanding of their CPS behaviors. Specifically, we examine people’s CPS behaviors based on a combination of a self-declared questionnaire study and a large log dataset. We provide a comprehensive analysis of the correlations between people’s demographic characteristics and their CPS behaviors. We subsequently examine to what extent the logs capture people’s self-declared CPS behaviours. Based on this two studies of correlations, we investigate the predictability of user demographic characteristics from both questionnaire-based and log-based data. We formulate this question as a classification problem, examine difficulties of predicting different demographics, compare the performance of cyber, physical and social features, and compare the performance of questionnaire based features and log-based features. We find that people’s CPS behaviors manifest a number of significant demographic associations, that can be revealed accurately from data captured in WiFi logs. In this study, log-based CPS behaviors support comparable accuracy of demographic traits predictions as corresponding questionnaires capturing user self-declared behaviors. In the future, we plan to investigate how to integrate people’s CPS behaviors together to seek more accurate demographic prediction, and we will also examine how fine-granularity log-based CPS features can predict user demographics.
This study contributes to the research on demographic predictability from large-scale, automatically collected cyber-physical datasets and is this of particular interest to operators of large instrumented environments as well as urban demographers.
Notes
Permission to issue the prize was given by the government of New South Wales.
A web classification service covering 600 million domains, http://www.brightcloud.com/.
To confirm that the significance of these relationships is not caused by random noise, we conduct a corresponding \(\chi^{2}\)-test (averaged 10 times) by randomly modify the relationship between questionnaire participants and their responses. The randomly modified data do not show significant associations.
References
Beam G (2012) The Problem with Survey Research. http://ovidsp.ovid.com/ovidweb.cgi?T=JS&PAGE=reference&D=psyc9&NEWS=N&AN=2012-11484-000
Murray D, Durrell K (2000) Inferring demographic attributes of anonymous Internet users. In: WEBKDD, vol 1836, pp 7-20. https://doi.org/10.1007/3-540-44934-5_1
Hu J, Zeng H-J, Li H, Niu C, Chen Z (2007) Demographic prediction based on user’s browsing behavior. In: Proceedings of the 16th international conference on World Wide Web (WWW’07). ACM, New York, pp 151-160. https://doi.org/10.1145/1242572.1242594. http://portal.acm.org.ezproxy.gl.iit.edu/citation.cfm?id=1242594
Goel S, Hofman JM, Sirer MI (2012) Who does what on the web: a large-scale study of browsing behavior. In: Proceedings of the sixth international AAAI conference on weblogs and social media, pp 130-137
Li H, Xu Z, Zhu H, Ma D, Li S, Xing K (2016) Demographics inference through wi-fi network traffic analysis. In: 35th annual IEEE international conference on computer communications (INFOCOM 2016), San Francisco, CA, USA, April 1-9, 2016. IEEE, New York, pp 10-14. https://doi.org/10.1109/INFOCOM.2016.7524528
Jones R, Kumar R, Pang B, Tomkins A (2007) I know what you did last summer: query logs and user privacy. In: CIKM, pp 909-913. https://doi.org/10.1145/1321440.1321573
Kosinski M, Stillwell D, Graepel T (2013) Private traits and attributes are predictable from digital records of human behavior. Proc Natl Acad Sci USA 110(15):5802-5805. https://doi.org/10.1073/pnas.1218772110
Bi B, Kosinski M, Shokouhi M, Graepel T (2013) Inferring the demographics of search users social data meets search queries. In: Proceedings of the 22nd international conference on World Wide Web (WWW’13). ACM, New York, pp 131-140. https://doi.org/10.1145/2488388.2488401
Culotta A, Ravi NK, Cutler J (2016) Predicting Twitter user demographics using distant supervision from website traffic data. J Artif Intell Res 55:389-408
Kamvar M, Baluja S (2006) A large scale study of wireless search behavior: Google mobile search. In: Proceedings of the SIGCHI conference on human factors in computing systems, Montreal, Quebec, Canada, April 22-27, 2006. ACM, New York, pp 701-709. http://dl.acm.org/citation.cfm?id=1124877
Kumar R, Tomkins A (2010) A characterization of online browsing behavior. In: Proceedings of the 19th international conference on World Wide Web (WWW’10). ACM, New York, pp 561-570. https://doi.org/10.1145/1772690.1772748
Filippova K (2012) User demographics and language in an implicit social network. In: Proceedings of the 2012 joint conference on empirical methods in natural language processing and computational natural language learning (EMNLP-CoNLL’12), Jeju Island, Korea, July 12-14, 2012. Association for Computational Linguistics, Stroudsburg, pp 1478-1488. http://dl.acm.org/citation.cfm?id=2390948.2391117
You Q, Bhatia S, Sun T, Luo J (2015) The eyes of the beholder: gender prediction using images posted in online social networks. In: IEEE international conference on data mining workshops (ICDMW’15), pp 1026-1030. https://doi.org/10.1109/ICDMW.2014.93
Seneviratne S, Seneviratne A, Mohapatra P, Mahanti A (2014) Your installed apps reveal your gender and more! In: Proceedings of the ACM MobiCom workshop on security and privacy in mobile environments (SPME’14). ACM, New York, pp 1-6. https://doi.org/10.1145/2646584.2646587
Mohammady E, Culotta A (2014) Using county demographics to infer attributes of Twitter users. In: N ACL joint workshop on social dynamics and personal attributes in social media, pp 7-16
Zhong E, Tan B, Mo K, Yang Q (2013) User demographics prediction based on mobile data. Pervasive Mob Comput 9(6):823-837. https://doi.org/10.1016/j.pmcj.2013.07.009
Wang P, Guo J, Lan Y, Xu J, Cheng X (2016) Multi-task representation learning for demographic prediction. In: Proceeding of the 38th European conference on IR research, pp 88-99
Stachl C, Bühner M (2015) Show me how you drive and I’ll tell you who you are recognizing gender using automotive driving parameters. Proc Manuf 3:5587-5594. https://doi.org/10.1016/j.promfg.2015.07.743
Byrnes JP, Miller DC, Schafer WD (1999) Gender differences in risk taking. Psychol Bull 125(3):367-383. https://doi.org/10.1037/0033-2909.125.3.367
Harris CR, Jenkins M, Glaser D (2006) Gender differences in risk assessment: why do women take fewer risks than men? Judgm Decis Mak 1(1):48-63
Laurila JK, Gatica-Perez D, Aad I, Blom J, Bornet O, Do T-M-T, Dousse O, Eberle J, Miettinen M (2012) The mobile data challenge: big data for mobile computing research. Technical report. https://doi.org/10.1016/j.pmcj.2013.07.014
Wang P, Guo J, Lan Y, Xu J, Cheng X (2016) Your cart tells you: inferring demographic attributes from purchase data. In: Proceedings of the ninth ACM international conference on web search and data mining (WSDM’16). ACM, New York, pp 173-182. https://doi.org/10.1145/2835776.2835783
Coluccia E, Louse G (2004) Gender differences in spatial orientation: a review. J Environ Psychol 24(3):329-340. https://doi.org/10.1016/j.jenvp.2004.08.006
Mislove A, Viswanath B, Gummadi KP, Druschel P (2010) You are who you know: inferring user profiles in online social networks. In: Proc. third ACM int. conf. web search data mining (WSDM’10), pp 251-260. https://doi.org/10.1145/1718487.1718519. http://portal.acm.org/citation.cfm?doid=1718487.1718519
Dong Y, Yang Y, Tang J, Yang Y, Chawla NV (2014) Inferring user demographics and social strategies in mobile social networks. In: ACM SIGKDD conference on knowledge discovery and data mining (KDD’14). ACM, New York, pp 15-24. https://doi.org/10.1145/2623330.2623703
Culotta A, Ravi NK, Cutler J (2015) Predicting the demographics of Twitter users from website traffic data. In: Proceedings of the twenty-ninth AAAI conference on artificial intelligence (AAAI’15). AAAI Press, Menlo Park, pp 72-78. http://dl.acm.org/citation.cfm?id=2887007.2887018
Bachrach Y (2016) Inferring perceived demographics from user emotional tone and user-environment emotional contrast. In: Proceedings of the 54th annual meeting of the association for computational linguistics (ACL 2016), pp 1567-1578. https://doi.org/10.18653/v1/P16-1148
Sapiezynski P, Stopczynski A, Wind DK, Leskovec J, Lehmann S (2017) Inferring person-to-person proximity using WiFi signals. Proc ACM Interact Mob Wearable Ubiquit Technol 1(2), Article ID 24. https://doi.org/10.1145/3090089
Sekara V, Lehmann S (2014) The strength of friendship ties in proximity sensor data. PLoS ONE 9(7), Article ID e0100915. https://doi.org/10.1371/journal.pone.0100915
Ashraf S, Iqbal HR, Nawab RMA (2016) Cross-genre author profile prediction using stylometry-based approach. In: Balog K, Cappellato L, Ferro N, Macdonald C (eds) Working notes of CLEF 2016 - conference and labs of the evaluation forum, Évora, Portugal, 5-8 September, 2016. CEUR workshop proceedings, vol 1609, pp 992-999. CEUR-WS.org. http://ceur-ws.org/Vol-1609/16090992.pdf
Santarcangelo V, Farinella GM, Battiato S (2015) Gender recognition: methods, datasets and results. In: IEEE international conference on multimedia & expo workshops (ICMEW). IEEE, New York. https://doi.org/10.1109/ICMEW.2015.7169756
Bekios-Calfa J, Buenaposada JM, Baumela L (2014) Robust gender recognition by exploiting facial attributes dependencies. Pattern Recognit Lett 36:228-234. https://doi.org/10.1016/j.patrec.2013.04.028
Geng X, Zhou ZH, Smith-Miles K (2007) Automatic age estimation based on facial aging patterns. IEEE Trans Pattern Anal Mach Intell 29(12):2234-2240. https://doi.org/10.1109/TPAMI.2007.70733
Song C, Qu Z, Blumm N, Barabasi A-L (2010) Limits of predictability in human mobility. Science 327(5968):1018-1021. https://doi.org/10.1126/science.1177170.0307014
Noulas A, Scellato S, Lambiotte R, Pontil M, Mascolo C (2012) A tale of many cities: universal patterns in human urban mobility. PLoS ONE 7(9), Article ID e37027. https://doi.org/10.1371/journal.pone.0037027
Noulas A, Scellato S, Mascolo C, Pontil M (2011) An empirical study of geographic user activity patterns in Foursquare. In: Proceedings of the fifth international AAAI conference on weblogs and social media, pp 570-573. https://doi.org/papers3://publication/uuid/557455DB-AC4A-4C73-968A-31E7A663BC4E
Ren Y, Salim FD, Tomko M, Bai YB, Chan J, Qin KK, Sanderson M (2017) D-log: a WiFi log-based differential scheme for enhanced indoor localization with single RSSI source and infrequent sampling rate. Pervasive Mob Comput 37:94-114. https://doi.org/10.1016/j.pmcj.2016.09.018
Okabe A, Boots B, Sugihara K, Chiu SN (1999) Spatial tesselations: concepts and applications of Voronoi diagrams, 2nd edn. Wiley series in probability and statistics. Wiley, New York
Ren Y, Tomko M, Salim FD, Ong K, Sanderson M (2017) Analyzing web behavior in indoor retail spaces. J Assoc Inform Sci Technol (JASIST) 68(1):62-76. https://doi.org/10.1002/asi.23587
Bai YB, Wu S, Ren Y, Ong K, Retscher G, Kealy A, Tomko M, Wu H, Zhang K (2014) A new approach for indoor customer tracking based on a single wi-fi connection. In: 2014 international conference on indoor positioning and indoor navigation
Church K, Smyth B, Cotter P, Bradley K (2007) Mobile information access: a study of emerging search behavior on the mobile Internet. ACM Trans Web 1(1), Article ID 4. https://doi.org/10.1145/1232722.1232726
Bowman AW, Azzalini A (1997) Applied smoothing techniques for data analysis. Oxford University Press, New York
Acknowledgements
We thank all the members of the TRacking Indoor Information BEhaviour (TRIIBE) project for a helpful discussion.
Funding
This research is supported by a Linkage Project grant of the Australian Research Council (LP120200413), including the design of the study, the collection, analysis, and interpretation of data, and the writing of the manuscript.
Author information
Authors and Affiliations
Contributions
YR, MT, FS, JC and MS equally scoped the survey study. YR and MT formulated the initial idea of user demographic across logs and survey responses. FS carried out the design of the survey questionnaire. JC carried out the design of the computational experiments. MS led the study and coordinated the research activities of the team. YR carried out the computational experiments and drafted the manuscript. All authors read, edited, and approved the final manuscript.
Corresponding author
Ethics declarations
Competing interests
The authors declare that they have no competing interests.
Additional information
Publisher’s Note
Springer Nature remains neutral with regard to jurisdictional claims in published maps and institutional affiliations.
Rights and permissions
Open Access This article is distributed under the terms of the Creative Commons Attribution 4.0 International License (http://creativecommons.org/licenses/by/4.0/), which permits unrestricted use, distribution, and reproduction in any medium, provided you give appropriate credit to the original author(s) and the source, provide a link to the Creative Commons license, and indicate if changes were made.
About this article

Cite this article
Ren, Y., Tomko, M., Salim, F.D. et al. Understanding the predictability of user demographics from cyber-physical-social behaviours in indoor retail spaces. EPJ Data Sci. 7, 1 (2018). https://doi.org/10.1140/epjds/s13688-017-0128-2
Received:
Accepted:
Published:
DOI: https://doi.org/10.1140/epjds/s13688-017-0128-2