- Regular article
- Open access
- Published:
The effect of anti-money laundering policies: an empirical network analysis
EPJ Data Science volume 11, Article number: 15 (2022)
Abstract
Aim
There is a growing literature analyzing money laundering and the policies to fight it, but the overall effectiveness of anti-money laundering policies is still unclear. This paper investigates whether anti-money laundering policies affect the behavior of money launderers and their networks.
Method
With an algorithm to match clusters over time, we build a unique dataset of multi-mode, undirected, binary, dynamic networks of natural and legal persons. The data includes ownership and employment relations and associated financial ties and is enriched with criminal records and police-related activities. The networks of money launderers, other criminals, and non-criminal individuals are analyzed and compared with temporal social network analysis techniques and panel data regressions on centrality measures, transitivity and assortativity indicators, and levels of constraint.
Findings
We find that after the announcement of the fourth EU anti-money laundering directive in 2015, money laundering networks show a significant increase in the use of foreigners and corporate structures. At the individual level, money launderers become more dominant in criminal clusters (increased closeness centrality). This paper shows that (the announcement of) anti-money laundering policies can affect criminal networks and how such effects can be tested.
1 Introduction
Money laundering means to disguise the illegal origin of criminal proceeds.Footnote 1 When criminals are so successful that their criminal revenue exceeds their ordinary daily living and operating expenses plus re-investment into new crime, they have to recycle the surplus of criminal money and inject it into the legal economy. Criminal revenues from drugs, human trafficking, cybercrime or fraudFootnote 2 can be laundered in different ways. The drug dealer, human trafficker or fraudulent manager can try to bring the criminal money to a bank, or heshe can set up companies and slip the criminal turnovers into the cash register of companies. He/she can do this in his/her own country or try to bring the money abroad. He/she can use cash couriers or set up complicated international constructions of shell companies with bank accounts in different countries, Such shell companies in turn receive and lend money with fake bills, or make mortgage payments to each other, without any or much real economic activity taking place. On average, this internationally circulating money through complex corporate constructions is pumped five times around the world [2] until it is finally parked in real estate, business, expensive cars or jewellery.
Over time, anti-money laundering (AML) policies became much stricter. Improved “know your customer” rules, and a wide range of financial and non-financial institutions like second-hand car dealers and real estate agents, who have to report unusual transactions, pose a new challenge for criminals. They have to find alternative and more sophisticated solutions to deal with the new regulatory environment.
This means that more complex networks between people (often family members) who can act as (straw) CEO of companies will emerge, and that lawyers, notaries, real estate agents, and bank employees will function as facilitators with higher risks of being detected by the authorities.
Organized crime, such as big drug cartels, can have specialized money launderers who cannot be easily replaced owing to their specialized knowledge of finance. These money launderers can be even more important to the cartel than the ‘padrone’ himself, who can be replaced by a successor. Given that these specialists cannot serve the entire field of all necessary activities of money laundering anymore, they have to collaborate with other specialists to complete the laundering process.
Therefore, money laundering professionals become more specialized, and even more important for the criminal network. Such launderers might only be able to develop and maintain a network of professionals within a specific geographical region, or they develop the knowledge and skills to perform one specific money laundering activity, like trade-based only, through shell corporations, or via lawyers, bankers or notaries within the financial system.
But are AML policies effective and efficient? In May 2015, the European Parliament announced a directive “on the prevention and use of the financial system for the purposes of money laundering or terrorist financing” [3], commonly known as the fourth anti-money laundering directive or AML-IV. This paper analyzes the effects that are caused by introducing new anti-money laundering policies on money laundering networks, and on individual launderers. Comparing network indicators from before and after the announcement allows us to get an indication of how money laundering networks react to policy changes. For example, we find that money laundering networks become bigger (i.e. the cluster size increases) and more international (i.e. national diversity increases). At the individual level money launderers normally want to minimize risks by linking to the least amount of people needed. In contrast, we find that stricter anti-money laundering (AML) policies cause them to link to more people instead (i.e. the degree centrality increases).
For this analysis, we conceptualized and empirically developed a large network containing different ties among people and businesses that were registered in the Netherlands from 2005 until 2019. We use administrative data with information about people, their family ties, shared bank accounts, and employment history and data from the chamber of commerce with corporate information and ownership relations. We retrieve and link criminal data about known police interventions and legal convictions to these links, and add all suspicious transactions of money laundering among them. Within this large network, we identify strongly connected clusters and follow these over time. We distinguish between three types of clusters: criminal clusters with known money laundering offenses, criminal clusters without known money laundering activities, and clusters for which no criminal events are recorded at all.
Large empirical datasets are usually scarce for criminological research in general, and in particular for studying criminal networks. The newly developed methodological approach applied in this paper can overcome this limitation and eventually increase our understanding of the behavior of criminals and the dynamics of social (criminal) network formation. Knowing how criminal networks respond to anti-money laundering policies helps regulators to design more effective and efficient policies. Increased knowledge on the formation of criminal networks also helps enforcement authorities improve the tools available for detection and investigation.
In general, AML policies are often accused of having high costs but not many visible benefits [4–6]. Studies about AML effectiveness often try to look whether money laundering decreases and use dark number estimation techniques with their accuracy being questionable, as well as the usefulness of the gained knowledge [7]. The method presented in this paper does not use such dark numbers estimations but is based on high quality administrative data instead. Our theoretical contribution adds to the literature on criminal networks through embedding the behavioral aspects of specialization, competition and collaboration. Empirically we test this by using a unique dataset from iCOV, the infobox Crimineel en Onverklaarbaar Vermogen, a collaboration between several Dutch authorities to share information on criminal and unexplainable wealth. In addition, this study also theoretically contributes to the literature by developing a methodology to identify the effects of AML policy measures using temporal cluster analysis.
This paper is structured as follows. Section 2 provides a brief literature review about money laundering and criminal networks. Next, Sect. 3 discusses the conceptual framework regarding our network measures and our model for network analysis. Section 4 describes the data used and Sect. 5 discusses the results. Finally, Sect. 6 concludes.
2 Literature review
2.1 Money laundering
AML regulations generally aim to reduce secrecy and enforce transparency with know-your-customer responsibilities and duties to report suspicious transactions for the gatekeepers of the financial sector such as banks and notaries. This additional information should help law enforcement agencies to detect and prosecute money laundering better. A comprehensive and detailed overview of the regulations is provided by Cox [7] and more condensed alternatives by Anderson [8] and Unger, Annex A.1 [9]. Within the European context several initiatives to combat money laundering have been implemented following Financial Action Task-Force (FATF) recommendations [3, 10–15].
There are several studies on the effectiveness of AML regulations. Examples are publications focusing on AML policies within the European Union [16], within developing countries [17], and comparing Singapore, Switzerland, and the UK [18].
Money laundering is an interdisciplinary field of research. Lawyers, political scientists, and public policy scholars traditionally focus on the development, implementation and execution of anti-money laundering policies, e.g. [19–21]. Criminologists typically study the behavior of money launderers, e.g. [22–24]. Economists tend to focus on analyzing the impact of money laundering on society and estimating the amount of money being laundered, e.g. [2, 25, 26].
If money laundering is policy relevant, it has to be a sizable problem with a huge impact on either the economy, society or politics, which legitimizes anti money laundering policy interventions. And if anti money laundering policy is effective, there should exist less money laundering over time, or at least a visible impact of this policy, such as detecting more money laundering activities, catching more launderers or confiscating more laundered money.
The literature focusing on the size of the problem by estimating the amount of money being laundered uses diverse techniques (see for a good overview Sect. 1 in [27]) ranging from more qualitative research methods like case studies, surveys, and interviews to quantitative studies like the currency demand [28] or the DYMIMIC [29] approach, and trade based quantitative models that analyse the expected extent of trade, and trade-pricing differences [30], or that use a gravity model [31, 32]. Ferwerda et al. [2] estimate all global money laundering flows at the bilateral level with such a gravity model. Although the estimates differ as much as their approaches, money laundering is generally seen as a large global phenomenon that can only be countered using a multi-disciplinary multi-national approach [33].
Grouped in 25 categories within a literature review, Ferwerda [26] identifies 86 different economic, social, and political effects that money laundering can have on the real, financial, and public sector. This indicates the importance of countering money laundering and helps setting the research agenda. Most of the effects mentioned in the literature have not yet been empirically tested, though.
Besides the amount of money being laundered and the significance of this problem, another strand of research aims at detecting laundering activities. For instance, some applied research uses machine learning within the banking system to detect potential money laundering activities [34]. Gao and Ye [35] review machine learning techniques that can improve the efficiency of money laundering detection, and promotes the use of network analysis? centrality measures to destabilize money laundering networks, as also promoted by e.g. Baker and Faulkner [36]. Duijn et al. [37] show that this can have adverse effects, by strengthening the networks instead.
Analyzing social networks, Fronzetti Colladon and Remondi [38] provide insights into the structural position and detection of high-risk money laundering profiles within the scope of a factoring company. They collected only 19 months of data and therefore cannot explore the long-term effects of AML regulation. We use the same structural measures, not for detecting potential laundering activities, but for analyzing the effects of AML policy.
2.2 Criminal organizations and dark networks
Due to the evolving AML and law enforcement policies aforementioned, criminal organizations have to navigate in an increasingly complex environment. This requires innovations in money laundering methods, the use of new technologies, and higher levels of international cooperation. Such developments can lead to changes in the structures and competences of criminal organizations and dark networks in general and the associated network indicators, especially for networks involving money laundering. For example, based on interviews with arrested drug criminals, Benson and Decker [39] argue that revenue-generating criminal organizations are, in contrast to what is believed about them, not highly hierarchically structured. Instead, they often consist of small isolated groups without any formal connections. Raab and Milward [40] point out that dark networks are dealing with two competing and contradictory needs of secrecy and information-processing. Since concealment tends to be more important, illegal networks have a tendency toward a decentralized structure unless the task necessitates a centralized one [41]. From a transnational perspective, Williams [42] states that organized crime is “increasingly operating through fluid network structures rather than more formal hierarchies”. Additionally, these papers show that criminal networks typically have both a core (strongly connected by friendship and family ties) and a less dense periphery which enables diversity and geographic coverage.
Although the popularity and maturity of social network analysis is continuously growing, such analyses are rarely applied in the study of criminal networks. Caused by the nature of criminal networks, several major problems for network analysis occur, being: (i) the amount of data and computational power needed, (ii) the covertness of criminal activities rendering data incomplete, (iii) ambiguities due to mixing criminal and legitimate activities and actors, causing fuzzy boundaries, and (iv) the timing of network interactions changing the strengths of ties, making detection algorithms report different results over time [43]. Given that this paper was written almost 30 years ago, technological developments can almost fully eliminate the first argument.
Social network analysis within the field of criminology has emerged rapidly since 2005 [44] but has been primarily descriptive [45]. One such report on known criminal networks, which is very elaborate, provides insights into their organization and activities [46]. The United Nations Office on Drugs and Crime has identified five common network structures: the standard, regional and clustered hierarchies, the core group, and criminal networks [46]. The hierarchical structures are typically vertical in structure and are based on control and division of labour, while the other structures are more horizontally organized and based on trust and professional expertise. The core group construction is typically associated with tax fraud and money laundering, due to their strong connections with the legitimate economy, their small size, and high professional expertise. The core group construct typically consists of a small, strongly connected group of individuals, surrounded by participants that are unrelated to each other.
Based on empirical data from Columbian criminal organizations and the Italian Mafia, the UNODC [46] observed that law enforcement transformed several hierarchical structures into core groups, making both typologies a common observation. An alternative explanation is that globalization has contributed similarly to crime as to legitimate business, by transforming hierarchical structures into more flexible collaborative networks [47]. The observed developments therefore seem to be fully explained neither by stronger enforcement nor by globalization alone. Inconsistencies in the UNODC [46] report are also observed in the analysis of 40 known criminal organizations. Money laundering, or “having a strong connection with the legitimate economy”, is mentioned for 25 of these organizations, of which only five are considered to have financial crimes as their main objective. Another three groups are expected to have significant links to money laundering in addition to their regular criminal activities. Out of the ten criteria on which each criminal organization is profiled, money laundering is argued to be best fitted for core groups with less than 20 people involved [46]. These groups portray little sense of identity, low amounts of violence, a strong penetration in the legitimate economy, and have access to a multitude of collaborators from other criminal organizations either within or outside their home country. Strangely though, when matching the six defined characteristics for money laundering networks with the eight money laundering intensive organizations selected, only 18 out of the possible 47 match the criteria [46].
There are only a few papers dealing with the effects of competition both within and between criminal networks. Most often, competition between criminals and regulators is analyzed, e.g. [48, 49]. Shifting the focus to competition and collaboration in public service delivery, Entwistle and Martin [50] propose three fields of interest, of which one can be applied specifically to the delivery of money laundering services: “encouraging trust may reduce conflict in relational exchange” (p. 237) [50]. Therefore, we expect decreasing trust when law enforcement agencies can force the constant rebuilding of relationships and trust. Contract self-enforcement within crime is frequently built on violence because neither legal enforcement nor police protection is a viable solution [51].
2.3 Criminal network structures and resilience
Social network analysis plays an important role in determining key persons to target, and how to disrupt networks [40, 52, 53]. For example, people with a high degree centrality are more likely to get arrested than those with a high betweenness centrality. Morselli [54] explains these dynamics in terms of brokerage, which is found to be higher in more sophisticated and developed criminal organizations. In the field of network analysis, the term brokerage is more technically referred to as “structural holes”, and usually provides competitive advantages in business networks [55]. Going even further back in time leads to similar insights into the importance of weak ties between groups versus the so-called strong ties within groups [56].
The risk of detection also influences the hierarchy of criminal networks. By studying criminal organizations in the Balkans, Stanojoska et al. [57] explain the need for horizontal and vertical division of roles. Vertical structures are aimed at protecting the criminal activities by reducing the knowledge known by each participant and hence a possible sell-out to the authorities. Horizontal role division is mainly related to specialization i.e. the complexity of the overall criminal activity. Horizontal structures are associated with high local autonomy, self-organizing governance, in-dividual reputation, reciprocity and trust, direct personal contacts, and consensus-based decision-making.
In general, there is a constant trade-off between efficiency and security in criminal networks. Security-focused networks tend to have a longer time-to-task span (i.e. efficiency is of lower importance), and centralities are more evenly distributed causing such networks to seemingly have no central players [58]. Actors in a criminal network can be purposely placed either strategically or vulnerably when the network is known to be under police scrutiny. Morselli [54] finds that members of a criminal network with higher levels of degree centrality (i.e. the number of connections to other members) have an increased probability to be arrested while a higher betweenness centrality (i.e. the brokerage position of the respective member) decreases this possibility.
The structure of a network also influences its resilience. Ayling [59] defines resilience as “the capacity to absorb and withstand disruption and to adapt to change when necessary” (p. 182), and argues that temporal analyses of such organizations are required to understand this concept. She warns that (police) interventions may lead to worsening circumstances [59], resilience of the networks increases. For example, using the concept of optimal criminal networks, based on the costs and benefits of network ties supported by their simulation, Easton and Karaivanov [60] argue that removing key actors from a criminal network may counter-intuitively lead to a more optimized structure, especially when the law enforcement policies are known. Bramoullé et al. [61] find that exogenously increasing the costs of crime (e.g. by implementing AML policies) may reduce the baseline level of crime, but it also increases the value of a (criminal) social network. In their research, this dynamic causes criminals to be isolated from a multitude of networks, which increases gang membership and its associated violence. In a similar fashion using Dutch Police data, Duijn et al. [37] confirm police interventions can strengthen criminal network efficiency (i.e. reduced dimensionality) due to the removal of old inefficient ties. Their study indicates that disrupting continuously and quickly, forces networks to become more redundant, making them better observable and reduces their secrecy and security. They argue that temporal analysis is needed to assess these effects. Also Everton and Cunningham [62] highlight the potential of analyzing dark networks over time and detect changes.
McBride and Hewitt [63] show in a laboratory experiment that when network structures are not completely known, disruption efforts should focus on actors in the network that are not monitored, even though this is risky (see also [64] for a discussion about the problems of fuzzy boundaries).
With our temporary analysis of criminal and laundering networks we hope to contribute to this literature. Though we are aware of the findings of Milward and Raab [65] who conclude that disruption efforts of dark networks will likely fail and dark networks stay resilient as long as the central problems behind their existence, such as larger societal and political problems, are not tackled.
3 Conceptual framework and model for network analysis
Social network analysis terminology is relatively established in the literature, but operationalization for criminal networks specifically requires some additional explanation (see Sect. 3.1 and Sect. 3.2). The hypotheses (Sect. 3.3) and their analysis approach (Sect. 3.4) are further explained.
3.1 Centrality measures
In general, centrality measures provide insight into the inner workings of a network and the structural importance of individual nodes. These levels indicate, e.g. the extent to which there is a centralized level of control in a network or leadership, the distance that needs to be traveled between nodes in terms of efficient communication patterns, or the ability of nodes to connect others.Footnote 3
Degree centrality
The degree centrality provides an indication to what extent a person is connected to others in the network. It is one of the most common measures in network analysis and counts the number of edges a specific node has. In a criminal network, a high degree centrality can have the disadvantage of more exposure to the risk of getting caught [54].
Betweenness centrality
Betweenness centrality, or brokerage, is linked to the importance of the node in connecting other nodes. It is defined as the sum of shortest paths (geodesics) between any two nodes that include the node of interest. This measure can be normalized by dividing the betweenness centrality by the maximum number of geodesics possible [67]. According to Morselli [54], higher betweenness centralities ensure bigger network gains and, if money laundering services are scarce, launderers can sustain a prominent position with respect to their betweenness and larger gains.
Closeness centrality
An indication to how close or distant one node is in comparison to all other nodes is assessed by the closeness centrality. Originally presented by Bavelas [68], closeness centrality is defined as the reciprocal of the sum of all geodesics’ length between all nodes that include the node of interest and is typically associated with the ability to control a network [69]. When anti-money laundering policies intensify, money launderers in the network need more of such control to mitigate the increased risk of exposure.
3.2 Structural measures
Structural measures in this paper are aimed at explaining potential strategic reasons for creating ties. Given the proverb “birds of a feather flock together”, which is explained as nodes with specific similarities tend to associate with one another, typically depicts the idea of assortativity measures. Transitivity measures provide information on the redundancy of connections, for example, cliques are typically defined as groups with a high transitivity, i.e. everybody knows each other.
Assortativity index
Assortativity is the extent to which similar nodes connect. Similarity can be defined in terms of the degree or betweenness centrality, the nationality of origin, and the criminal activity performed. Assortativity can be defined on a nominal level by classifying based on the node’s characteristics, taking the fraction of edges between similar nodes with respect to edges with non-similar nodes. For assortativity based on nationalities and crime types, the nominal assortativity is used. Assortativity of nodes for the cluster they belong to is not used, given that the clustering algorithm uses this characteristic to determine the clusters. This measurement should therefore always be around unity.
Alternatively, the value of a specific node property can be used, e.g. instead of the type of crime binding the connections, the number of connections (degree centrality) may better predict the availability of a mutual connection. For the degree centrality measure, this weighted assortativity index is used instead.
In this paper the assortativity is used to test whether criminals tend to connect to other criminals, thus forming a potential value chain for providing specific services. The opposite is also possible: some criminals might intentionally not connect to other criminals, trying to keep a safe distance for detection reasons. The same applies to nationality which represents, e.g. a mutual cultural background or specific country-level involvement in criminal activity. Hence although a negative assortativity is expected, the associated trend should increase (i.e. higher values of assortativity are expected over time).
Transitivity index
A transitive relation is defined by the requirement that two neighbors of a specific node are also connected, i.e. the friends of my friend are my friends. The normalized measure is defined in [70], but in the un-weighted network model of our paper weights can be omitted, making the strength of the node equal to its degree. Therefore out of the maximum possible number of connections that may exist between the neighbors of a node, only those connections that close a triplet are counted and normalized by the total amount of possible connections.
Higher transitivity, or higher clustering coefficient, means that the cluster is more efficient but less secure. This is typical for networks that focus on shorter time-to-task operations [58], like street sales of drugs, or money laundering activities such as depositing small amounts of cash into the legal system (smurfing / structuring). When anti-money laundering policies intensify, we might expect that the criminal networks to which professional launderers connect start competing with each other more. This can manifest in increased betweenness of money launderers and a decrease in the transitivity index.
Constraint and structural holes
Structural holes are defined as “the separation between non-redundant contacts” (p. 18) [55] and operationalized with a measure of constraint [71]. When the constraint is 1 there is either a high connectedness between the nodes within one’s ego-network, i.e. more redundant, or alternatively, the node’s degree is low.
Given that a high connectedness (i.e. a high constraint) is also indicated by the transitivity index, calculating this constraint would by definition imply a positive correlation between the constraint and the transitivity index and a negative correlation between the constraint and degree centrality. It is expected that a lower constraint (i.e. less redundancy) also causes a higher betweenness given that nodes with a path length of more than two most likely have to traverse through the nodes of interest to reach the other nodes.
In the organizational network literature networks with many structural holes are found to be more innovative and able to initiate and adapt to changes [72], a quality that is essential for money laundering networks when anti-money laundering policies intensify. In addition to Granovetter [56] who emphasized the importance of the strength of ties, the structural hole focuses on node characteristics and argues that the strength of the tie is defined by the position of the node [55].
Walker et al. [73] discuss the importance of these constraints on the formation and enforcement of norms within networks and cooperation between networks by linking structural holes to social capital theory. When anti-money laundering policies intensify, viable money laundering methods might become more complex, requiring specialization. Such specialization creates the need for more cooperation making structural holes more important for the survival and innovative capacity of money laundering.
3.3 Hypotheses and model specification
When anti-money laundering policies intensify, what should happen to the money laundering resources available and how would that affect existing criminal networks? Since a more complex regulatory setting requires an increased variability to meet the new needs [74], we expect that money launderers have to improve their skill-set to remain undetected. Hence money launderers specialize either by investing in a stronger infrastructure within the region and finding more lenient jurisdictions [75] or investing in product-related infrastructure using, e.g. digital currencies or change from traditional banking to types of trade [76].
A common microeconomic approach for dealing with increasing risk levels without product innovation is updating the risk premium, i.e. increasing the costs for money laundering services. But this does not change the increased risk of getting caught, leading to the rationale that in such cases, criminals wishing to launder their proceeds via professional money launderers, need to pay a higher fee and at the same time are exposed to an increased risk themselves for losing their proceeds and potentially getting caught as well. [77]).
Some money launderers might stop providing their services when the higher risk level surpasses their individual risk aversion threshold, or they do not have the capacity to further innovate their services. The amount of launderers is expected to decrease, either because money launderers stop by choice or due to losing their customers due to the higher risk, increasing scarcity of money laundering services.
Criminal networks would need to diversify their money laundering portfolio to reduce the overall risk while the number of specialists decreases. Given that the number of connections in a network affects the exposure of the launderers and brokerage ensures profitability [54], the ability to maintain a structural hole position [55] becomes of primary interest (also suggested by the efficiency and security trade-off in criminal networks [58]). Therefore, although money launderers might have to increase their ties with other launderers, they will try not to continuously increase their ties with others. Hence, criminal networks would have to compete over getting connections to professional money laundering services, forcing them to collaborate with each other to jointly utilize the existing connections. At the same time, criminal clusters will compete with other criminal clusters to keep their existing connections.
Specialization within money laundering activities as a response to the intensifying anti-money laundering measures requires collaboration to provide a comprehensive service package. Therefore we hypothesize that money laundering clusters grow in size, and the number of ties between launderers grows too, making the networks less secure but more efficient, given the known trade-off in criminal networks [58]. To account for the subsequent decrease in security, we would expect less direct connections and more indirect connections, causing the diameter (p. 111) to increase and the cluster’s density (p. 101) [67] to decrease. Given that specialized money launderers need to collaborate with other money launderers to retain a complete money laundering service, we expect money laundering networks to increase in crime-type assortativity [78]. Given that specialization of money laundering services is related to the infrastructure provided by professional launderers and the associated underlying trust, we expect that launderers are more likely to connect individuals with the same nationality, increasing the nationality assortativity or to collaborate with more diverse countries, increasing the nationality diversity. From a cluster level perspective the following hypotheses are tested:
Hypothesis 1
Specialization of money launderers causes their clusters to a) grow in size and diameter, while decreasing in density, b) collaborate and specialize in criminal activity, increasing criminal assortativity and disproportionality, and c) collaborate with specialized regional launderers, increasing national assortativity and diversity.
As stated, with respect to individual launderers, degree centrality is expected to increase, but given their position as independent service providers that deal with multiple criminal clusters, their structural position in the network changes. Because professional launderers in a resource-constrained market are assumed to serve diverse criminal groups, they are expected to facilitate connections between these groups. Therefore, a clustering technique that employs the strength of mutual connectivity, like the Louvain clustering technique used in this paper [79], places such nodes in the periphery of a cluster.
Adding people or companies directly connected to the launderer in the periphery decreases the closeness centrality since more geodesics are directed through the launderer. However, placing them further in the network or adding additional ties can increase their closeness centrality, reducing the associated geodesics. Adding nodes directly also decreases the betweenness centrality of money launderers, but adding them indirectly increases it instead. Given the security considerations of both professional launderers and their customers and the resource scarcity of money laundering services, customers will try to remain unconnected to each other and preferentially not be directly connected to launderers, rendering the constraint of the money launderers lower [71]. Therefore, at the individual level, the following hypotheses are tested:
Hypothesis 2
Specialization of money launderers causes individual money laundering professionals to a) create ties to other launderers and consequently increase their degree centrality, b) develop a higher closeness and betweenness centrality, given the indirect connections and their additional ties, and c) actively manage risks with redundant relations and decrease their constraint.
3.4 Statistical analysis
To test the hypotheses of this paper, we use statistical econometric analyses for the diverse cluster- and node-based measures. Each indicator varies per crime group over time and is, as dependent variable, represented by \(y_{it}\) in the form of eq. (1).
If clusters or nodes contain money laundering activities, they are marked as \(l_{it} = 1\) and \(c_{it} = 0\). When forms of crime are detected but no money laundering activities are known, \(l_{it} = 0\) and \(c_{it} = 1\). The resulting coefficients are provided in relation to the control group in which no crime has been detected at all in the cluster(\(c_{it} = l_{it} = 0\)). Since clusters are associated to criminal and money laundering activities over the whole timespan of their existence, the group allocation of each cluster does not change over time, thus the subscript for these variables can be adjusted, dropping time, thus \(l_{it} = l_{i}\) and \(c_{it} = c_{i}\).
To determine whether to use a fixed or random effects model, we assume that the detection of criminal activity and money laundering is a stochastic process, rendering the dummy indicators to be determined by chance. Therefore the divide between known and unknown money laundering clusters is fuzzy. Additionally, all clusters where crime has been detected consist of both suspected criminals and presumably innocent bystanders who happen to know these people. Hence the criminal clusters must share properties of non-criminal clusters. Based on the reasons above, the chosen method of analysis is a random effects panel regression.Footnote 4
The dummy variable \(a_{t}\) indicates whether the observation was dated after the year of implementing AML-IV in 2015 (\(a_{t} = 1\)) or not (\(a_{t} = 0\)). In eq. (2) interaction terms are added to isolate the effect of AML-IV on the different groups.Footnote 5 Only the effects on all clusters (\(\beta _{3}\)), money laundering clusters (\(\delta _{1}\)), and other criminal clusters (\(\delta _{2}\)) are reported.
The coefficient \(\beta _{0}\) provides the intercept, \(\beta _{1}\) and \(\beta _{2}\) indicate the difference of criminal clusters with and without money laundering activities compared to the group without criminal activities. The effect of important events in 2015 (in which the implementation of AML-IV took place) on all groups regardless of the type of criminal activities is captured in \(\beta _{3}\). This leaves the coefficients \(\delta _{1}\) and \(\delta _{2}\) to indicate the effect of AML-IV on money laundering clusters and criminal clusters without money laundering, respectively.
3.5 Social network analysis
The model’s source is a temporal undirected two-mode network graph, in which the two sets are defined as a) actors: the natural and legal persons, i.e. the people and companies involved, and b) actions: the criminal convictions and citizen-police interactions that are associated to the individual actors. The second set’s elements are classified in six different level-1 groups as explained in Sect. 4.2 and shown in Table 1.
Loops are allowed in the network but can only occur in case of suspicious transactions to oneself or in case someone is self-employed. Multiple links among actors are allowed and frequently occur. Edges between the actors and actions are always a so-called star shape, i.e. actors can have multiple actions but each action is only linked to one actor. Given that the network is undirected, the sociomatrix is symmetric.
The relations between natural persons are defined by the family ties, being parenthood, sibling, and marriage ties or by residential ties (living at the same address). Ties between natural and legal persons are defined by ownership and employment relations, and ties between legal persons relate to ownership only. The network contains ties between nodes defined by shared bank accounts and suspicious transactions. The data allows for multiple relations between two nodes, but most network measures do not apply a weight and just use the number of ties.
For any structural analysis of the network (calculating centralities or clustering), a sub-network is created by omitting all elements from the actions set and its associations (the level of crime is already defined and assigned to the actor in the form of an edge count).
For the network analysis, the R environment [81] is used in combination with the iGraph package [82] which implements the Louvain clustering method [79] and diverse centrality, transitivity, assortativity, and constraint measures. More information about the software is listed in Sect. A.1.
3.6 Temporal network clustering
A common approach for temporal network clustering is to infer that high inter-connectivity between groups of nodes is a good indication of the presence of a community. One such version is implemented in the so-called Louvain clustering algorithm [79]. After collecting the data, social networks are annually drafted to find the dynamics of the associated clusters. While this approach performs well in static observations, having nodes moving between clusters within a dynamic setting requires a more complex approach. Since the clustering algorithm is time-insensitive, meaning that the assigned identifier of a cluster in one year could be completely different the next year, an additional step is required. The technical challenge is to match the temporal allocation of clusters, in other words, linking the correct clusters to each other. While identifying the intersection between two clusters in adjacent periods indicates the extent to which two clusters contain the same nodes, merely choosing the largest intersection in each period may result in poor performance over multiple periods.
A similar problem exists in resource planning, known as a linear sum assignment problem. When different contractors are asked to provide their price for tasks in a project, selecting the lowest price first may leave other tasks more expensive because the cheaper contractor was already contracted for a task. To select the contractors in such a way that the lowest possible total price is reached, an algorithm is developed known as the Hungarian method [83–85]. Instead of aiming for the lowest total price, we aim for the highest total intersection for our temporal network clustering.
4 Data collection and creation
The Dutch governmental organization “infobox Crimineel en Onverklaarbaar Vermogen” (iCOV) is a collaborative platform in which several Dutch government and non-government authorities share data, knowledge, and experience. Among them are the tax authorities, police forces, customs, the fiscal intelligence police, the financial intelligence unit (FIU), and the public prosecution office. The Dutch National Bank and Chambers of Commerce also provide data to iCOV. Besides efficiently supporting daily operations of criminal investigations, the platform contributes to the strategic development of the partners. In line with these objectives, their aim includes contributing to the scientific community, progressing the development of data science which in turn helps solve specific problem areas, such as money laundering and diverse fraud schemes.
The data collection for this paper starts with unusual transactions reported by reporting institutions (such as banks and notaries) that the Dutch FIU classified as suspicious transactions. We combine these with general information about the involved individuals or companies, like date of birth or founding, gender and company type, and nationality. Family and professional relations are added, like parent/child relations, marriages, shared bank accounts, employment history according to the tax services and corporate ownership, and corporate relations like (beneficial) ownership, employment, and access to shared bank accounts.
4.1 Sampling procedure
We start with a random selection of 50 transactions from the database of suspicious transactions (the first edges). Information on the involved persons and companies (nodes) is retrieved from the civil database or the chambers of commerce, respectively. The first-degree egocentric level of each retrieved node is then searched for, of which a random maximum sample of 50 subsequent nodes per source node are collected for both people and corporations separately, with a maximum of 2500 connections per accessed data table. This limitation is implemented due to external restrictions on retrieving a complete dataset and to avoid a single large company filling all the available spots. Randomization is used to ensure a representative sample.
The second-degree egocentric network is retrieved for all newly added nodes in a similar fashion. As a third level, we retrieve all additional connections between the already available nodes. To ensure the ability to perform temporal analysis, all nodes have a date of birth or death, and companies’ dates of creation and bankruptcy or closure. All relational data is time-stamped and placed as edges into a network with their respective nodes. We then retrieve all criminal records and known police-citizen interactions related to the people and companies in the database. These are added to the network as additional nodes and edges. These newly added nodes and edges are not taken into account when calculating network measures but are added for visualization purposes. The network generation process is repeated five times to generate five independent random samples. Figure 1 shows one of the retrieved networks with separated clusters and diverse criminal indicators.

Example of retrieved sub-graphs with separated clusters and indicators for crime types (in sequential order): all crimes, market crimes, financial crimes, laundry crimes, cyber crimes and violence crimes. One figure that shows the retrieved network six times. Each time, nodes are colored red to indicate a different type of criminal activity (being: all crimes, market crimes, financial crimes, laundry crimes, cyber crimes and violence crimes)
The sampling procedure is subject to three types of biases. First, given that the procedure starts with retrieving known suspicious transactions, the sample is somewhat biased towards crime. Given the sparsity of the suspicious transactions, a random sample of people would result in very few associated transactions. In the year 2020, out of the 722 thousand reported unusual transactions only 104 thousand were considered suspicious [86]. With over 17 million residents in the Netherlands a sample of 1000 residents would result (on average) in finding only 6 suspicious transactions, which is too little for performing a cluster analysis.
Therefore, the non-criminal clusters in our sample might not fully represent truly non-criminal clusters, since the included actors have to be indirectly related to a suspicious transaction to show up in the sample, despite our analysis indicating that their dominant cluster contains no actors related to crime. These non-criminal clusters, in terms of their characteristics and behavior, can be ‘closer’ to criminal clusters than ‘truly’ non-criminal clusters. Having significant differences between the criminal and non-criminal clusters would thus be less likely in our model, meaning that the significant differences we do find are conservative estimates. Basically, we might underestimate the observed policy effect given our sampling technique, but are more convinced of the effect in case of significant findings. This also leads to the amount of crime retrieved in these samples is not an indication of the national crime levels (which is also not intended in this study).
Second, the sample is also biased towards containing transactions that have actually been reported. Sophisticated money launderers who have been able to obfuscate all of their money laundering transactions in the last 15 years, will not be present in the initial sample. Of course, when they collaborate with other launderers whose transactions are discovered and appear in our initial sample, they will be included in the network. For this reason, it is expected that this bias is negligibly small. This is a common problem in most empirical criminological literature.
The third and final bias is the actual classification of unusual transactions to suspicious ones. The unusual transactions that are reported but not considered suspicious according to FIU Netherlands, the Dutch fiscal intelligence unit, are not part of the network’s ties. Given that we do not have access to the reported unusual transactions, details on the bias cannot be determined.
4.2 Justice and police data
In the Netherlands, all police actions are registered and feasibly linked to the person(s) involved. This can range from a false alarm report, to standard alcohol controls, to a building being raided, to armed incidents. While many of these classifications are of no use for our research, we re-coded and classified most of them into several subsets of categories as shown in Table 1. Also the classification codes used in the retrieved criminal records are re-coded in the same category structure. This allows us to aggregate reported incidents and find patterns on proven, convicted crimes as well as by suspicions of crime (police-citizen interaction without legal conviction, yet).
Out of the 344 different police-citizen interactions available, 275 are not included in the analysis. They consist of different kinds of traffic accidents, drunk driving and alcohol controls, violation of driving bans, parking issues and other sporadic traffic related incidents (e.g. having an animal on the road). In addition some frequently occurring theft crimes, like stealing bicycles, mopeds or cars, burglaries and responding to (false) alarms, and pick-pocketing are out of scope for our money laundering specific analysis. Other aspects that are considered unrelated to money laundering are cases of vandalism, police officers responding to fire alarms, environmental violations and dealing with (public) nuisances. The 69 types of crime we do use in our analysis are drugs, human trafficking, diverse kinds of fraud, money laundering, cybercrime, and diverse kinds of violence such as blackmail, kidnapping and terror.
4.3 Data related restrictions
Time series data on a well-functioning legal system is sparse since criminals are prosecuted and jailed in case of more serious crimes. By default, this results in gaps in the dataset where no criminal activity occurs for the jailed individual while serving their sentence. To solve the problem of many gaps in the data, this analysis uses aggregated criminal activity on the cluster level which appears but never expires.
Figure 2 shows the development of a single cluster with known money laundering activities over time, starting from 2005 (left top) until 2019 (right bottom), biannually. Each node represents either a natural person, male or female (blue or pink) or a legal person (yellow, emerging in 2009). The orange and red nodes that appear in 2017 and 2019 identify police actions and court rulings, respectively. The size of each node is related to its degree centrality. The ties between the nodes are based on family relations (green), professional ties (yellow) and a shared bank account that emerged in 2013 (orange).

Example of the temporal development of a cluster that contains known money laundering activities. One figure that shows the development of a single cluster in the network. It shows 8 annual snapshots within the period of 2005 until 2019)
4.4 Summary statistics
We merge the five retrieved random samples into a single dataset. To avoid having a biased dataset that emphasizes data collected for nodes and clusters that have been retrieved in multiple samples, the data is cleaned of duplicates by removing any duplicated cluster with associated nodes that contains a repeated individual. In the case of duplicate clusters with different levels of retrieved criminal activity, the money laundering cluster is retained. When there is no money laundering record in the cluster, the case with most levels of crime is kept. This process is chosen to maximize the amount of crime in the dataset because criminal data is least represented.
The available data covers the years 2005 to 2019, for which the number of clusters and their criminal activity is displayed in Fig. 3. The number of money laundering related clusters ranges between 7 and 17, criminal activity without money laundering ranges from 39 to 42 clusters, and those with no form of crime range between 87 and 124 clusters.
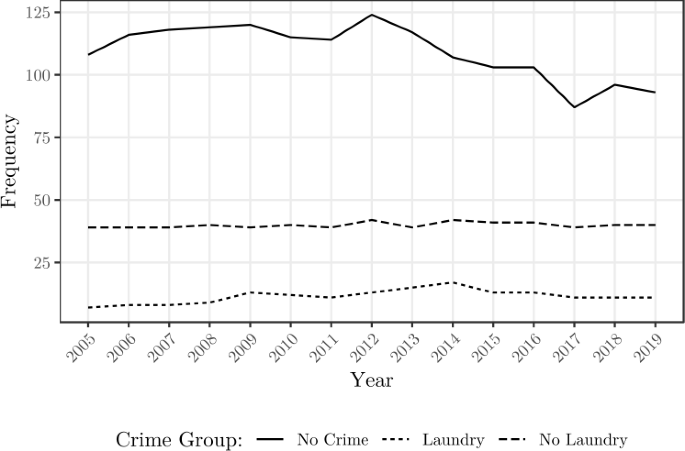
Number of clusters detected per year per crime type. This figure shows a line chart that shows the number of money-laundering, criminal and not-criminal clusters are detected in each annual snapshot of the entire network
The summary statistics in Table 2 are recorded at the cluster levelFootnote 6 and in Table 3 at individual level.Footnote 7
5 Results
Our results aim to provide insight into the extent of collaboration and competition between criminals and money launderers as observed in their respective network structures before and after AML-IV was announced. Since intensified anti-money laundering policies should make money laundering more complex, we expect those who provide such services professionally will have to specialize and collaborate with each other. The criminal networks that use professional money laundering services will collaborate with some criminal clusters to maximize access to money laundering professionals and at the same time compete with other criminal clusters to protect their access to these services.
In all models, the \(R^{2}\) and adjusted \(R^{2}\) metrics are fairly low, but given the invisible nature of covert criminal activities, this is expected and does not invalidate the model’s goodness-of-fit.Footnote 8
5.1 Cluster size
Cluster size is represented by the number of nodes that form the cluster, i.e. people and companies. This indicates the potential magnitude of the cluster or the amount of influence it could have on a population. Additionally, the cluster size is assessed by its diameter, which is the shortest distance between the two nodes that are furthest away from each other.
Although there is volatility in money laundering related clusters due to fewer observations, as visually depicted in Fig. 4, it seems that the size of all clusters (all lines), while different, follow a similar growing trend. The number of people involved in money laundering clusters (the dotted line) suddenly grows after 2014, while corporate presence dropped steeply during the financial crisis but is also growing steadily after 2015, in contrast with the criminal clusters without money laundering activities. The average diameter of all types of clusters slowly increases over time and remains higher for the criminal clusters.
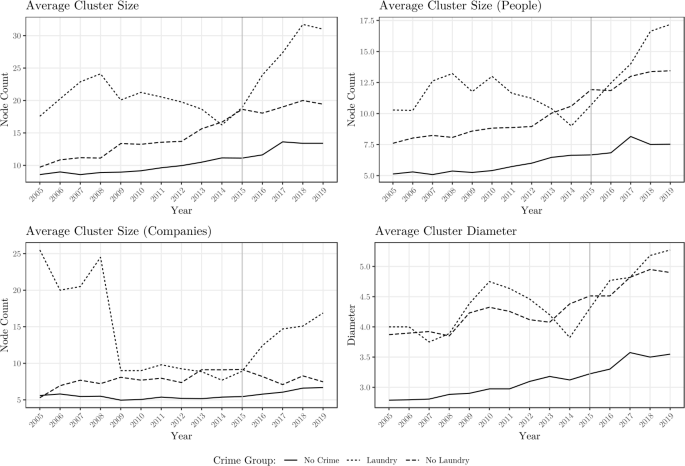
Cluster measures of size. This figure shows 4 line charts that show the development for each cluster type on average cluster size, average cluster size (people), average cluster size (companies) and the average cluster diameter
The models related to cluster size, presented in Table 4, statistically confirm that both types of criminal clusters have significantly more people involved (\(\beta _{1}=2.731\), \(\sigma _{\bar{l}}=1.107\), \(p<0.05\) for money laundering and \(\beta _{2}=2.473\), \(\sigma _{\bar{c}}=0.729\), \(p<0.01\) for criminal clusters without money laundering) compared to non-criminal clusters. After 2015, when AML-IV was announced, all clusters grew in size (\(\beta _{3}=2.776\), \(\sigma _{\bar{a}}=0.357\), \(p<0.01\)), but money laundering (\(\delta _{1}=5.555\), \(\sigma _{\bar{la}}=1.044\), \(p<0.01\)) and criminal (\(\delta _{2}=4.087\), \(\sigma _{\bar{ca}}=0.626\), \(p<0.01\)) clusters grew even stronger. Especially the corporate involvement in the money laundering clusters increased (\(\delta _{1}=4.607\), \(\sigma _{\bar{la}}=0.781\), \(p<0.01\)).
Figure 4 shows a corporate decline in money laundering clusters that started during the financial crisis but is recovering to its previous level since AML-IV was announced (\(\delta _{1}=4.607\), \(\sigma _{\bar{la}}=0.781\), \(p<0.01\)). The statistics demonstrate a significant impact of AML-IV on the diameter of clusters for both types of criminal activity (\(\beta _{3}=0.501\), \(\sigma _{\bar{a}}=0.052\), \(p<0.01\)), in which criminal clusters are affected significantly (\(\delta _{1}=0.270\), \(\sigma _{\bar{ca}}=0.089\), \(p<0.01\)).
5.2 Representation
Cluster representation is measured in terms of the representation of crime and nationalities. Figure 5 shows the development of the average true diversity [88] and the average (dis)proportionality of representation [89] within each cluster for both criminal activities and the presence of nationalities. In the first two visualizations, criminal clusters without money laundering activities are the control group instead of clusters with no crime.
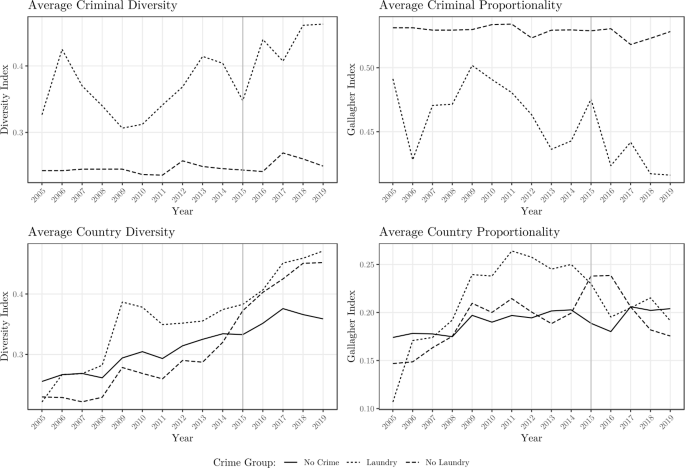
Cluster measures of representation. This figure shows 4 line charts that show the development for each cluster type on average criminal diversity, average criminal proportionality, average country diversity and average country proportionality
Money laundering clusters are more diverse concerning the prevalent types of crime, i.e. the number of different crime types is higher and less disproportionally represented). For the representation of diversity in involved countries (measured by nationality), money laundering clusters are more diverse although criminal clusters that have no detected money laundering activities are catching up. Representation was less proportional for money laundering clusters but a decrease in dis-proportionality around the announcement of AML-IV is observable for criminal networks with and without money laundering activities.
The models shown in Table 5 demonstrate the significance of the overall larger crime diversity of money laundering clusters (\(\beta _{1}=0.228\), \(\sigma _{\bar{l}}=0.060\), \(p<0.01\)) and their more proportional representation of these countries (\(\beta _{1}=-0.120\), \(\sigma _{\bar{l}}=0.030\), \(p<0.01\)). Although crime diversity continues to increase for all criminal clusters after AML-IV is announced (\(\beta _{3}=0.037\), \(\sigma _{\bar{l}}=0.009\), \(p<0.01\)), the money laundering related clusters do not show a significant difference (\(\delta _{1}=-0.027\), \(\sigma _{\bar{la}}=0.019\), \(p\geq 0.1\)). While a similar trend continues for criminal proportionality, after the AML-IV announcement, money laundering clusters have been affected by a decreasing proportionality of criminal representation (\(\delta _{1}=0.016\), \(\sigma _{\bar{la}}=0.010\), \(p<0.1\)). The involvement of different nationalities increased for all clusters after the announcement of AML-IV (\(\beta _{3}=0.038\), \(\sigma _{\bar{a}}=0.006\), \(p<0.01\)), and even more for both money laundering (\(\delta _{1}=0.045\), \(\sigma _{\bar{la}}=0.017\), \(p<0.01\)) and criminal clusters without money laundering (\(\delta _{2}=0.088\), \(\sigma _{\bar{ca}}=0.010\), \(p<0.01\)). A significant lower proportionality for money laundering clusters is observed (\(\beta _{1}=0.054\), \(\sigma _{\bar{l}}=0.026\), \(p<0.05\)), but only for criminal clusters a somewhat significant decrease of the proportionality (increase of dis-proportionality) for national representation is observed (\(\delta _{2}=0.019\), \(\sigma _{\bar{ca}}=0.011\), \(p<0.1\)).
5.3 Cluster connections
Analyzing the connections within clusters is based on the measures of cluster density, i.e. the number of connections in relation to the maximum possible connections [67] and average assortativity, i.e. the extent to which nodes with certain properties connect to other nodes with similar characteristics [78]. Both measures indicate collaboration within the cluster, namely the extent of and preferences towards collaboration, respectively. When new nodes are allocated to clusters and they are not connected to other nodes within that cluster, the cluster density decreases.
As shown in Fig. 6, both money laundering and criminal clusters show a similar trend in decreasing density, which seems much less for non-criminal clusters. While highly connected individuals would typically connect with less connected individuals (which is indicated with a negative value), this correlation diminishes over time. After AML-IV was announced, money laundering related clusters connected more to the same nationality. Due to the small number of individual crime observations before 2014, assortativity measures for crime could not be calculated.

Cluster measures of connectivity. This figure shows 4 line charts that show the development for each cluster type on average cluster density, average degree assortativity, average crime assortativity and average country assoertativity
The statistical results in Table 6 show that the announcement of AML-IV is correlated with a significant decrease in cluster density of both money laundering related (\(\delta _{1}=-0.076\), \(\sigma _{\bar{la}}=0.025\), \(p<0.01\)) and non-money laundering related (\(\delta _{2}=-0.154\), \(\sigma _{\bar{ca}}=0.015\), \(p<0.01\)) criminal clusters.
Although the data on crime assortativity is limited, compared to criminal clusters, people in money laundering related clusters seem to have somewhat weaker connections (\(\beta _{1}=-0.294\), \(\sigma _{\bar{l}}=0.176\), \(p<0.1\)) to other people with a potential criminal history.
5.4 Individual centrality
Changing from a cluster-level analysis to a node-level analysis, individual centrality measures provide insights into how clusters are connected. The degree centrality provides information about the average number of connections per entity. The shape of the cluster is better defined by the betweenness centrality in which average higher values indicate a larger periphery and a stronger central group. The distance between the periphery and the central players can be indicated by the closeness centrality.
Visually analyzing the centrality of nodes within the network shows (see Fig. 7) that money laundering related individuals have decreased their human connections since AML-IV was announced but increased their corporate degree. After the announcement of AML-IV, they continuously increase their brokerage position given the observed betweenness centralities, especially the corporate forms. In general, the distance between the core and periphery of all clusters (as indicated by the closeness centrality) increased and after 2015 decreased again for both people and corporate centralities.
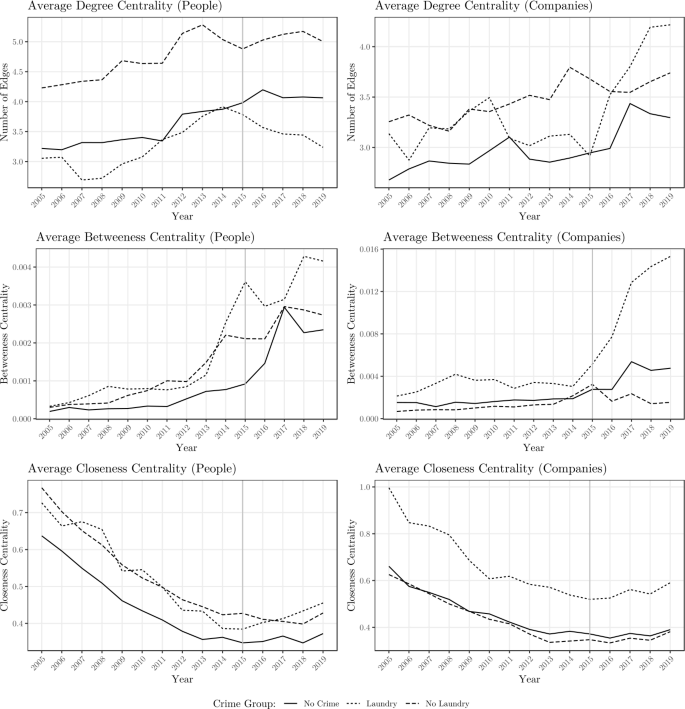
Cluster average of individual centrality measures. This figure shows 6 line charts that show the development for individual nodes within a cluster type on average degree centrality, average degree centrality and average closeness centrality, separated into people and companies
The announcement of AML-IV seems to have a significant effect on the number of connections among people and corporations together (\(\beta _{3}=0.721\), \(\sigma _{\bar{a}}=0.029\), \(p<0.01\)) as shown in Table 7. Also for criminals not related to money laundering, the degree centrality increased a little (\(\delta _{2}=0.270\), \(\sigma _{\bar{ca}}=0.049\), \(p<0.01\)), but the effect on launderers is much stronger (\(\delta _{1}=1.038\), \(\sigma _{\bar{la}}=0.304\), \(p<0.01\)). For money launderers, this increase of degree centrality also increased the betweenness centrality (\(\delta _{1}=0.004\), \(\sigma _{\bar{ca}}=0.002\), \(p<0.01\)). While the closeness centrality decreased after announcing AML-IV in general (\(\beta _{3}=-0.103\), \(\sigma _{\bar{a}}=0.001\), \(p<0.01\)), money laundering clusters responded with a strong increase (\(\delta _{1}=0.046\), \(\sigma _{\bar{la}}=0.012\), \(p<0.01\)) while criminal clusters without money laundering decreased (\(\delta _{2}=-0.009\), \(\sigma _{\bar{ca}}=0.002\), \(p<0.01\)) instead.
Table 8 shows similar effects for connections to people only, but the significance of AML-IV’s effect on criminal clusters without money laundering activities (\(\delta _{2}=0.0002\), \(\sigma _{\bar{ca}}=0.0003\), \(p\geq 0.1\)) disappeared.
5.5 Individual position
The individual position of a node in the network indicates the importance of that node within the cluster. Both transitivity [67] and constraint [55], which are closely related, indicate the extent to which individuals can exploit their connections.
Figure 8 shows that transitivity among launderers increased around when AML-IV was announced, which seems to stabilize again around the level before that period. For companies, this dynamic seems to remain at a slightly higher level. The structural hole argument in which the brokerage position enables actors to innovate [71], an essential characteristic under higher levels of competition, is more important for money laundering clusters (a lower measure of constraint indicates a higher brokerage position) but has consistently been deteriorating since 2011. The corporate constraint, while volatile, has retained similar.
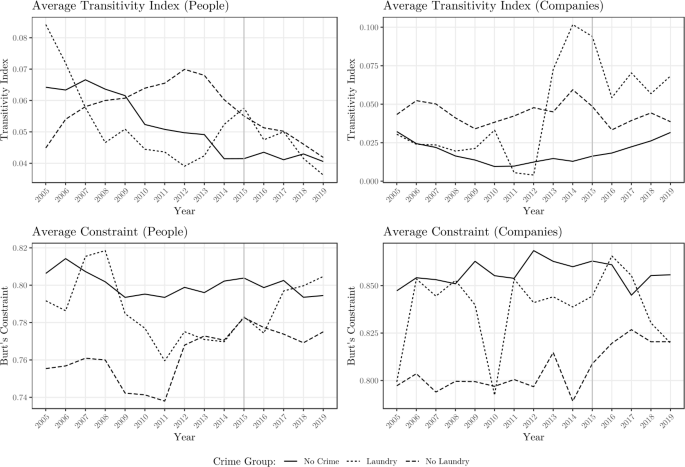
Cluster measures of position. This figure shows 4 line charts that show the development for individual nodes within a cluster type on average transitivity index and average constraint, separated into people and companies
The statistics with respect to individuals in Table 8 show the significant negative effects of AML-IV on both transitivity (\(\delta _{1}=-0.026\), \(\sigma _{\bar{la}}=0.011\), \(p<0.05\)) and constraint (\(\delta _{1}=-0.084\), \(\sigma _{\bar{la}}=0.013\), \(p<0.01\)) on individual launderers. This differs little when looking at the same coefficients in the complete model of Table 7. Given that the analysis in this section is performed at the individual level and crime cannot be allocated individually to companies, a corporate-only analysis is not relevant.
5.6 Summarizing results
Table 9 summarizes the key results. The table’s columns show the retrieved regression coefficients, \(\delta _{1}\) for specific effects by clusters with money laundering, \(\delta _{2}\) for specific effects by criminal clusters without money laundering, and \(\beta _{3}\) for the time trend independent of any criminal activity, respectively. Each row in Table 9 indicates the regression models specific for the listed dependent variable. The signs of the coefficients are compared with the expectations to infer the effect of intensifying AML policies.
Comparing money laundering clusters (\(\delta _{1}\)) with criminal clusters without money laundering (\(\delta _{2}\)) (within the same table row) indicates that intensifying AML policies have an effect. Comparing the results with the overall “after AML-IV” effect (\(\beta _{3}\)) gives insight into general temporal developments that are group insensitive or captures possible data availability issues. Cluster specific effects include the general effect, hence the general effect (\(\beta _{3}\)) does not indicate type-specific effects (\(\delta _{1}\) and \(\delta _{2}\)) per se.
Our first hypothesis states that specialization, competition and collaboration developments affects money laundering related clusters. With respect to increasing the size (\(\delta _{1}=5.555\), \(\sigma _{\bar{la}}=1.044\), \(p<0.01\)) and decreasing the cluster density (\(\delta _{1}=-0.076\), \(\sigma _{\bar{la}}=0.025\), \(p<0.01\)), we see indications to confirm the hypothesis, but not with respect to the increasing diameter (\(\delta _{1}=-0.038\), \(\sigma _{\bar{la}}=0.149\), \(p\geq 0.1\)). The dis-proportionality of criminal representation (\(\delta _{1}=0.016\), \(\sigma _{\bar{la}}=\), \(p<0.1\)) is weakly confirmed, while the increase of its assortativity (\(\delta _{1}=0.194\), \(\sigma _{\bar{la}}=0.188\), \(p\geq 0.1\)) is not indicated by our results. Assortativity with respect to the nationalities involved (\(\delta _{1}=0.010\), \(\sigma _{\bar{la}}=0.027\), \(p\geq 0.1\)) is inconclusive. The associated diversity (\(\delta _{1}=0.045\), \(\sigma _{\bar{la}}=0.017\), \(p<0.01\)) increases as expected. All, except one, of the variables show the expected sign and most (seven out of ten) are significant.
At the individual level, our second hypothesis states that the degree centrality (\(\delta _{1}=1.038\), \(\sigma _{\bar{la}}=0.304\), \(p<0.01\)) of money launderers is expected to increase, as well as their closeness (\(\delta _{1}=0.046\), \(\sigma _{\bar{la}}=0.012\), \(p<0.01\)) and betweenness (\(\delta _{1}=0.004\), \(\sigma _{\bar{la}}=0.002\), \(p<0.01\)) centralities, while we expect the constraint of launderers (\(\delta _{1}=-0.085\), \(\sigma _{\bar{la}}=0.013\), \(p<0.01\)) to decrease. With respect to these money laundering related individuals, we find all the expected directions.
6 Conclusions
Given the ongoing arms race between authorities and money launderers, assessing the impact of intensifying anti-money laundering (AML) regulation and understanding how criminal organizations respond is of key importance. This paper, therefore, sets out to explore the effects of announcing the European Union’s fourth anti-money laundering directive (AML-IV) in 2015 on money laundering networks in the Netherlands. We find indications that money laundering networks changed after AML-IV was announced.
We hypothesize that AML-IV makes it harder to launder money and that therefore criminals involved in the laundering process might have to specialize themselves more, by, e.g., focusing on a specific region or using specific (parts) of money laundering methods. A higher level of specialization would mean money laundering professionals from different disciplines need to collaborate to complete the money laundering process. Using specialists instead of generalists also requires the involvement of more individuals and therefore, the need for these highly skilled specialists grows while their availability reduces. Consequently, the level of competition among criminal networks to use money laundering professionals increases. The effects of these newly created dynamics in criminal networks, caused by specialization, collaboration, and competition, are tested at both the group and individual level.
The required data for this analysis has been provided through the support of a Dutch collaboration between several (non-)governmental organizations, known as “infobox Crimineel en Onverklaarbaar Vermogen” (iCOV). We use this data to compile temporal network structures with known and suspected criminal activity, enabling differentiation between money laundering related clusters, clusters that are linked to other criminal activities, and clusters for which no criminal activity is known. We use the retrieved and classified network structures to analyze the temporal changes and test the hypotheses.
The effects of increased levels of specialization and consequently competition and collaboration are observed in all clusters combined since AML-IV was announced in 2015. This is the expected development, with some scholars speaking of “hyperspecialization” [90]. But interestingly, money laundering clusters and often also criminal clusters without money laundering respond stronger, indicating that the anti-money laundering policies of 2015 might have affected money laundering practices. One of these responses is the strongly increasing number of companies involved in money laundering networks. This can be an indicator for the increased risk of detection and signifies the importance of managing the quality of corporate registers and sharing this information internationally. We observe diversity of involved nationalities in money laundering networks indicating the internationalization of money laundering activities. International cooperation has always been an important factor in the fight against money laundering and there is no sign that this will change in the foreseeable future.
We also find effects of the announcement of AML-IV on the individual level. The degree centrality of money launderers increased significantly since 2015, increasing the risk of detection under the security/efficiency trade-off. Potential indicators for specific money laundering effects may be the betweenness centrality and constraint, since money launderers responded significantly to AML-IV, while criminals without money laundering relations followed the general trend.
We find that AML policies complicate the money laundering environment, forcing launderers to specialize and collaborate. We conclude this from the fact that the money laundering clusters grow stronger in size and diameter than other criminal networks. This in turn increases the exposure of money launderers and their chance of getting caught.
Our results imply that law enforcement agencies with access to more detailed and non-anonymous data could adopt a network analysis methodology like the one presented in this paper to expose potential money laundering activities. Our research is a first attempt to show how social network analysis can eventually be a valuable tool to understand the effect of anti-money laundering policies, the behavior of money launderers and their networks. Our network measures can eventually be used as target variables for policy interventions. Our methodology can then be used to track how these measures change in response to policy interventions.
6.1 Limitations of our criminal network analysis
Looking at criminal networks from a purely instrumental viewpoint is efficient for testing hypotheses, but risky when the indicators are not clearly related to explainable dynamics because the underlying research hypothesis may be improperly stated. Therefore Campana [91] promotes the Quadratic Assignment Procedure [92] as a useful alternative for hypothesis testing on structural properties of criminal networks. Despite the method’s popularity, the resulting probabilities used for hypothesis testing are irrelevant, given that the procedure is designed for a non-parametric test and thus any assumption on the error distribution used to calculate a test statistic is therefore meaningless [93].
Although social network analysis is emerging in the field of criminology, theoretical underpinnings seem to be missing [45]. Papachristos [45] calls for the development of theory on how structural indicators may explain the dynamics in larger social processes such as learning, reciprocity, and loyalty. With an empirical temporal analysis of the network structures, this paper tries to contribute to the understanding of money laundering, but more theoretical underpinnings are eventually needed.
Other major events that changed the money laundering landscape in 2015 could affect our results in the same way as the announcement of AML-IV. In that case, we cannot distinguish between events and therefore have to assume that such events would also complicate money laundering activities. The observed general trends can also be explained by excluding money laundering activities in criminal prosecution, given the complexity of collecting the required evidence as well as the undetectability of such covert operations. In general, criminal activities happen continuously and often remain hidden, therefore also our data of recorded crime underestimates the real criminal prevalence. If undetected crime has a significantly different network structure than detected crime, our analysis might be biased. (see also [94])
Availability of data and materials
Given that the data holds information in individuals, including their criminal records, confidentiality requirements require, including the general data protection regulation, that the data is anonymized and may not be distributed in any form or shape. Therefore the data has been analyzed on-site at a secure location. The organization responsible for maintaining the associated database is “infobox Crimineel en Onverklaarbaar Vermogen” (iCOV). For questions on the data, the R scripts or the used analysis tools (see Sect. A.1), please contact the corresponding author.
Notes
The precise definitions by each EU Member State in the native language and an English translation that are used for legal references to money laundering and tax crime are found in [1].
See for the latest list of 22 crimes, so called predicate offenses, which qualify for a money laundering crime the Financial Action Task Force website https://www.fatf-gafi.org/glossary/d-i/ and the 6th AML Directive of June 2021, see https://eur-lex.europa.eu/legal-content/EN/TXT/?uri=CELEX:52021PC0421
For a random effects model, it is assumed that no fixed effects are present but may result in inconsistent estimators, which has been tested for all the models in this paper Using a Hausman test [80]. The test indicates that significant differences between the fixed and random effects model exist, but could not be rejected in any model (indicating that the random effects model is not inconsistent while more efficient), except for the model in which the dependent variable is country-level assortativity, where the difference of the coefficients of interacting AML-IV with money laundering clusters changed from 0.203*** (0.049) in the fixed effects model to 0.201*** (0.048) in the random effects model.
Due to the mutual exclusiveness of the group allocation, the interaction between “money laundering” and “no money laundering” is always 0 and will always be dropped from the model. Under the random effects model assumptions, the unobserved effect \(\alpha _{i}\) and error term \(\epsilon _{it}\) can be combined in the composite error term, \(\nu _{it}\).
To avoid confusion, the definition of a cluster in this paper requires a minimal size of 5 connected nodes as shown in the “Node Count” in Table 2. The minimum people and company count is 0 since there are clusters with no people or no companies involved.
The betweenness and closeness centralities are normalized to avoid combining very large and very small numbers in the regression equations that results rounding the coefficients to a value 0.0000.
According to Shalizi [87], either a small variance in the dependent variable or a larger error-term causes the \(R^{2}\) to approach near zero. This potentially precludes the use of this measure for the goodness-of-fit, as demonstrated in a theoretical proof where a low \(R^{2}\) is reported while the model predictions are 100% accurate [87]. Our data has a large representation of non-criminal clusters; the money laundering and criminal clusters are relatively sparse. This makes the dependent variable’s variance and the total sum-of-squares small when non-criminal clusters have a relatively small variance. It makes the model as a whole insensitive to variance within the criminal clusters, thus tailoring the goodness-of-fit assumption merely towards non-crime clusters. 4Our goal is not to explain the cluster- and node-based measures but to analyze changes after AML intensifications. The F-value shows the significance of all models, indicating that our models have predictive capacity.
Abbreviations
- AML :
-
Anti-Money Laundering
- AML-IV :
-
Fourth Anti-Money Laundering Directive
- DYMIMIC :
-
Dynamic Multiple-Indicators Multiple-Causes
- EU :
-
European Union
- FATF :
-
Financial Action Task-Force
- FIU :
-
Fiscal Intelligence Unit
- iCOV :
-
inforbox Crimineel en Onverklaarbaar Vermogen
- UNODC :
-
United Nations Office on Drugs and Crime
References
Rossel L, Unger B, Batchelor J, Vallejo F (2019) Utrecht codebook on fiscal fraud to empower regulators. https://doi.org/10.5281/zenodo.3476656. https://zenodo.org/record/3476656
Ferwerda J, van Saase A, Unger B, Getzner M (2020) Estimating money laundering flows with a gravity model-based simulation. Sci Rep 10(1):1–11. https://doi.org/10.1038/s41598-020-75653-x
European Union (2015) Directive (EU) 2015/849 of the European Parliament and of the Council of 20 May 2015. Off J Eur Union 58:73–117
Levi M, Reuter P (2006) Money laundering. Crime Justice 34(1):289–375
Ferwerda J (2018) The effectiveness of anti-money laundering policy: a cost-benefit perspective. In: The Palgrave handbook of criminal and terrorism financing law. Springer, Cham, pp 317–344. https://doi.org/10.1007/978-3-319-64498-1_14
Levi M, Reuter P, Halliday T (2018) Can the AML system be evaluated without better data? Crime Law Soc Change 69(2):307–328. https://doi.org/10.1007/s10611-017-9757-4
Cox D (2014) Handbook of anti money laundering. Wiley, Chichester. www.Ebook777.com
Anderson MJ, Anderson TA (2015) Anti-money laundering: history and current developments. J Int Bank Law Regul 30(10):521–531
Unger B (2017) Offshore activities and money laundering: recent findings and challenges. European Parliament. Directorate-General for Internal Policies. Policy Department A: Economic and Scientific Policy, 1–61. https://doi.org/10.2861/539319
European Union (1991) Council Directive 91/308/EEC of 10 June 1991 on prevention of the use of the financial system for the purpose of money laundering. Off J Eur Communit L(166):77–82
European Union (2001) Directive 2001/97/EC of the European Parliament and of the Council of 4 December 2001 amending Council Directive 91/308/EEC on prevention of the use of the financial system for the purpose of money laundering. Off J Eur Communit L 344/77(6):76–81
Financial Action Task Force (2003) The forty recommendations. Technical report, Financial Action Task Force
European Union (2005) Directive 2005/60/EC of the European Parliament and of the Council of 26 October 2005 on the prevention of the use of the financial system for the purpose of money laundering and terrorist financing. Off J Eur Union 25-11-2005(1):15–36
Financial Action Task Force (2004) FATF 40 recommendations. Technical report, Financial Action Task Force. http://www.fatf-gafi.org/media/fatf/documents/FATF Standards - 40 Recommendations rc.pdf
European Union (2018) Directives directive (EU) 2018/843 of the European Parliament and of the Council of 30 May 2018. Off J Eur Union 2018(648):32
Unger B, Ferwerda J, van den Broek M, Deleanu I (2014) The economic and legal effectiveness of the European Union’s anti-money laundering policy. Edward Elgar, Cheltenham, p 264. https://doi.org/10.4337/9781783472772. http://www.elgaronline.com/view/9781783472765.xml
Levi M (2012) How well do anti-money laundering controls work in developing countries? In: Reuter P (ed) Draining development? The World Bank, Washington, pp 373–413. https://doi.org/10.1596/978-0-8213-8869-3. Chap. 12. http://elibrary.worldbank.org/doi/book/10.1596/978-0-8213-8869-3
Melorose J, Perroy R, Careas S (2015) A comparative guide to anti-money laundering. Statewide Agricultural Land Use Baseline 2015 1. https://doi.org/10.1017/CBO9781107415324.004. arXiv:1011.1669v3
Sharman JC (2008) Power and discourse in policy diffusion: anti-money laundering in developing states. Int Stud Q 52(3):635–656. https://doi.org/10.1111/j.1468-2478.2008.00518.x
Halliday T, Levi M, Reuter P (2020) Why do transnational legal orders persist? In: Shaffer G, Aaronson E (eds) Transnational legal ordering of criminal justice. Cambridge University Press, Cambridge, pp 51–83. https://doi.org/10.1017/9781108873994.002. Chap. 2. https://www.cambridge.org/core/product/identifier/9781108873994%23CN-bp-2/type/book_part
Muller WH, Kälin CH, Goldsworth JG (2012) Anti-money laundering: international law and practice. Wiley, Hoboken. https://doi.org/10.1002/9781119208969
Kramer J-A, Blokland A, Soudijn M (2020) Witwassen als bedrijfsmatige activiteit: de verborgen netwerken van witwassers. Tijdschr Criminol 62(4):365–382. https://doi.org/10.5553/TvC/0165182X2020062004001
Riccardi M, Levi M (2018) Cash, crime and anti-money laundering. In: The Palgrave handbook of criminal and terrorism financing law. Springer, Cham, pp 135–163. https://doi.org/10.1007/978-3-319-64498-1_7. Chap. 7. http://link.springer.com/10.1007/978-3-319-64498-1
Soudijn M, Reuter P (2016) Cash and carry: the high cost of currency smuggling in the drug trade. Crime Law Soc Change 66(3):271–290. https://doi.org/10.1007/s10611-016-9626-6
Unger B, Rawlings G, Siegel M, Ferwerda J, de Kruijf W, Busuioic M, Wokke K (2006) The amounts and effects of money laundering. Technical Report April 2015, Dutch Ministry of Finance report. http://www.ftm.nl/wp-content/uploads/2014/02/witwassen-in-nederland-onderzoek-naar-criminele-geldstromen.pdf
Ferwerda J (2013) The effects of money laundering. In: Unger B, van der Linde D (eds) Research handbook on money laundering. Edward Elgar, Cheltenham, pp 35–46. Chap. 3
Unger B (2009) Money laundering—a newly emerging topic on the international agenda. Int Rev Law Econ 5(2):807–819. https://doi.org/10.2202/1555-5879.1417
Tanzi V, Shome P (1993) A primer on tax evasion. IMF Staff Pap 40(4):807–828
Schneider F (2006) Shadow economies of 145 countries all over the world: what do we really know? In IZA World of Labor (No. 2315; IZA Discussion Paper Series, Issue 2315)
Zdanowicz JS (2009) Trade-based money laundering and terrorist financing. Int Rev Law Econ 5(2):854–878. https://doi.org/10.2202/1555-5879.1419
Walker J, Unger B (2009) Measuring global money laundering: “the Walker gravity model”. Int Rev Law Econ 5(2):821–853. https://doi.org/10.2202/1555-5879.1418
Ferwerda J, Kattenberg M, Chang H-HH, Unger B, Groot L, Bikker JA (2013) Gravity models of trade-based money laundering. Appl Econ 45(22):3170–3182. https://doi.org/10.1080/00036846.2012.699190
Buchanan B (2004) Money laundering—a global obstacle. Res Int Bus Finance 18(1):115–127. https://doi.org/10.1016/j.ribaf.2004.02.001
Le Khac NA, Kechadi M-T (2010) Application of data mining for anti-money laundering detection: a case study. In: 2010 IEEE international conference on data mining workshops. IEEE, Sydney, pp 577–584. https://doi.org/10.1109/ICDMW.2010.66. http://ieeexplore.ieee.org/document/5693349/
Gao Z, Ye M (2007) A framework for data mining-based anti-money laundering research. J Money Laund Control 10(2):170–179. https://doi.org/10.1108/13685200710746875
Baker WE, Faulkner RR (1993) The social organization of conspiracy: illegal networks in the heavy electrical equipment industry. Am Sociol Rev 58(6):837–860
Duijn PAC, Kashirin V, Sloot PMA (2014) The relative ineffectiveness of criminal network disruption. Sci Rep 4. https://doi.org/10.1038/srep04238
Fronzetti Colladon A, Remondi E (2017) Using social network analysis to prevent money laundering. Expert Syst Appl 67:49–58. https://doi.org/10.1016/j.eswa.2016.09.029
Benson JS, Decker SH (2010) The organizational structure of international drug smuggling. J Crim Justice 38(2):130–138. https://doi.org/10.1016/j.jcrimjus.2010.01.001
Raab J, Milward HB (2003) Dark networks as problems. J Public Adm Res Theory 13(4):413–439. https://doi.org/10.1093/jopart/mug029
Baker WE, Faulkner RR (1993) The social organization of conspiracy: illegal networks in the heavy electrical equipment industry. Am Sociol Rev 58(6):837. https://doi.org/10.2307/2095954
Williams P (2001) Transnational criminal networks. In: Arquilla J, Ronfeldt D (eds) Networks and netwars: the uture of terror, crime, and militancy. RAND Corporation, Santa Monica, pp 61–97. Chap. 3
Sparrow MK (1991) The application of network analysis to criminal intelligence. Soc Netw 13(3):251–274. https://doi.org/10.1016/0378-8733(91)90008-H
Papachristos AV (2011) The coming of a networked criminology? In: MacDonald JM (ed) Measuring crime and criminality, 1st edn. Routledge, New York. Chap. 5
Papachristos AV (2014) The network structure of crime. Sociol Compass 8(4):347–357. https://doi.org/10.1111/soc4.12147
UNODC (2002) Results of a pilot survey of forty selected organized criminal groups in sixteen countries. Technical report, United Nations Office on Drugs and Crime
Aguilar-Millan S, Foltz JE, Jackson J, Oberg A (2008) The globalization of crime. Futurist 42(6):41–50
Banerjee S, Van Hentenryck P, Cebrian M (2015) Competitive dynamics between criminals and law enforcement explains the super-linear scaling of crime in cities. Palgrave Commun 1. https://doi.org/10.1057/palcomms.2015.22
Garoupa N (2007) Optimal law enforcement and criminal organization. J Econ Behav Organ 63(3):461–474. https://doi.org/10.1016/j.jebo.2004.04.010
Entwistle T, Martin S (2005) From competition to collaboration in public service delivery: a new agenda for research. Public Adm 83(1):233–242. https://doi.org/10.1111/j.0033-3298.2005.00446.x
Reuter P (1983) Disorganized crime: the economics of the visible hand. PhD thesis, Massachusetts Institute of Technology, Cambridge, MA
Jackson JL, Herbrink JCM, Jansen RWJ (1996) Examining criminal organizations: possible methodologies. Transnatl Organ Crime 2(4):83–105
Roberts N, Everton SF (2020) Strategies for combating dark networks. J Soc Struct 12(1):1–32. https://doi.org/10.21307/joss-2019-030
Morselli C (2010) Assessing vulnerable and strategic positions in a criminal network. J Contemp Crim Justice 26(4):382–392. https://doi.org/10.1177/1043986210377105
Burt RS (1995) Structural holes: the social structure of competition. Harvard University Press, Cambridge. https://ebookcentral.proquest.com/lib/uunl/detail.action?docID=3300361
Granovetter M (1973) The strength of weak ties. Am J Sociol 78(6):1360–1380
Stanojoska A, Blagojce P, Ivona S (2015) Structure of organized criminal groups originating from the Balkan Peninsula: models of trafficking in human beings criminal groups. In: The 4th international scientific and professional conference ‘police college research days in Zagreb’, Zagreb, p 689
Morselli C, Giguère C, Petit K (2007) The efficiency/security trade-off in criminal networks. Soc Netw 29(1):143–153. https://doi.org/10.1016/j.socnet.2006.05.001
Ayling J (2009) Criminal organizations and resilience. Int J Law Crime Justice 37(4):182–196. https://doi.org/10.1016/j.ijlcj.2009.10.003
Easton ST, Karaivanov AK (2009) Understanding optimal criminal networks. Glob Crime 10(1–2):41–65. https://doi.org/10.1080/17440570902782444
Bramoullé Y, Kranton R, D’Amours M (2014) Strategic interaction and networks. Am Econ Rev 104(3):898–930
Everton SF, Cunningham D (2013) Detecting significant changes in dark networks. Behav Sci Terrorism Polit Aggress 5(2):94–114. https://doi.org/10.1080/19434472.2012.725225
McBride M, Hewitt D (2013) The enemy you can’t see: an investigation of the disruption of dark networks. J Econ Behav Organ 93:32–50. https://doi.org/10.1016/j.jebo.2013.07.004
Burcher M, Whelan C (2015) Social network analysis and small group ‘dark’ networks: an analysis of the London bombers and the problem of ‘fuzzy’ boundaries. Glob Crime 16(2):104–122. https://doi.org/10.1080/17440572.2015.1005363
Brinton Milward H, Raab J (2006) Dark networks as organizational problems: elements of a theory 1. Int Public Manag J 9(3):333–360. https://doi.org/10.1080/10967490600899747
Toth N, Gulyás L, Legendi RO, Duijn PAC, Sloot PMA, Kampis G (2013) The importance of centralities in dark network value chains. Eur Phys J Spec Top 222(6):1413–1439. https://doi.org/10.1140/epjst/e2013-01935-7
Wasserman S, Faust K (1994) Social network analysis: methods and applications. Chemistry & …, 825. https://doi.org/10.1017/CBO9780511815478
Bavelas A (1950) Communication patterns in task-oriented groups. J Acoust Soc Am 22(6):725–730. https://doi.org/10.1121/1.1906679
Krebs VE (2002) Mapping networks of terrorist cells. Connections 24(3):43–52
Barrat A, Barthelemy M, Pastor-Satorras R, Vespignani A (2004) The architecture of complex weighted networks. Proc Natl Acad Sci 101(11):3747–3752. https://doi.org/10.1073/pnas.0400087101. arXiv:cond-mat/0311416
Burt RS (2004) Structural holes and good ideas. Am J Sociol 110(2):349–399. https://doi.org/10.1086/421787
Battilana J, Dimitriadis S, Gargiulo M (2012) Change agents, networks, and institutions: a contingency theory of organizational change. Acad Manag J 55(2):381–398. https://doi.org/10.5465/amj.2009.0891
Walker G, Kogut B, Shan W (1997) Social capital, structural holes and the formation of an industry network. Organ Sci 8(2):109–125. https://doi.org/10.1287/orsc.8.2.109
Olson M (1965) The logic of collective action: public goods and the theory of groups. Harvard University Press, Cambridge, p 186
Unger B, Rawlings G (2008) Competing for criminal money. Glob Bus Econ Rev 10(3):331. https://doi.org/10.1504/GBER.2008.019987
Unger B, den Hertog J (2012) Water always finds its way: identifying new forms of money laundering. Crime Law Soc Change 57(3):287–304. https://doi.org/10.1007/s10611-011-9352-z
Ferwerda J (2009) The economics of crime and money laundering: does anti-money laundering policy reduce crime? Rev Law Econ 5(2):903–929. https://doi.org/10.2202/1555-5879.1421
Newman MEJ (2003) Mixing patterns in networks. Phys Rev E, Stat Phys Plasmas Fluids Relat Interdiscip Topics 67(2):13. https://doi.org/10.1103/PhysRevE.67.026126. arXiv:cond-mat/0209450v2
Blondel VD, Guillaume J-L, Lambiotte R, Lefebvre E (2008) Fast unfolding of communities in large networks. J Stat Mech Theory Exp 10008(10):6. https://doi.org/10.1088/1742-5468/2008/10/P10008. arXiv:0803.0476
Wooldridge JM (2013) Introductory econometrics—a modern approach, vol. 120–121, 5th edn. South-Western CENGAGE Learning, Mason, p 910. http://www.ncbi.nlm.nih.gov/pubmed/21708159. arXiv:1011.1669v3
R Core Team (2018) R: a language and environment for statistical computing. Vienna, Austria. https://www.r-project.org/
Csárdi G, Nepusz T (2006) The igraph software package for complex network research. InterJ Complex Syst 1695(5):1–9
Papadimitriou C, Steiglitz K (1982) Combinatorial optimization: algorithms and complexity. Prentice Hall, Englewood Cliffs
Kuhn HW (1955) The Hungarian method for the assignment problem. Nav Res Loistics Q 2:83–97
Kuhn HW (1956) Variants of the Hungarian method for assignment problems. Nav Res Logist Q 3:253–258
(2020) Financial Intelligence Unit—The Netherlands: annual review FIU—The Netherlands 2020. Technical report. https://www.iea.org/reports/the-netherlands-2020#executive-summary
Shalizi C (2015) Lecture 10: F-tests, \(R^{2}\), and other distractions
Agresti A, Agresti BF (1978) Statistical analysis of qualitative variation. Sociol Method 9:204–237
Gallagher M (1975) Disproportionality in a proportional representation system: the Irish experience. Polit Stud 23(4):501–513. https://doi.org/10.1111/j.1467-9248.1975.tb00087.x
Malone TW, Laubacher R, Johns T (2011) The big idea: the age of hyperspecialization. Harv Bus Rev 89(7–8):56
Campana P (2016) Explaining criminal networks: strategies and potential pitfalls. Methodol Innov 9:205979911562274. https://doi.org/10.1177/2059799115622748
Mantel N (1967) The detection of disease clustering and a generalized regression approach. Cancer Res 27(2):209–220
Krackhardt D (1992) A caveat on the use of the quadratic assignment procedure. J Quant Anthropol 3(4):279–296
Morris JF, Deckro RF (2013) SNA data difficulties with dark networks. Behav Sci Terrorism Polit Aggress 5(2):70–93. https://doi.org/10.1080/19434472.2012.731696
Acknowledgements
We are grateful for the support provided by “infobox Crimineel en Onverklaarbaar Vermogen” (iCOV) in providing data and funds to conduct the research required for this paper. We are also thankful to the participants of several workshops held at iCOV and to the anonymous reviewers who provided critical reviews and suggestions for improving the paper. Any potentially undetected errors, of course, are the sole responsibility of the authors. Even though all data was fully anonymized, given its confidential nature, no dataset nor detailed scripts will be provided publicly. Therefore, in case of specific queries please contact the corresponding author. Copies of the used anonymized data and database scripts are stored at iCOV. The authors claim to have contributed to this research for academic and policy development purposes only. None of the authors have actively contributed to any enforcement or other activities that lead to the possible identification of individuals. We thank the editor and two anonymous reviewers for their useful comments on our work and their concrete suggestions, especially of including literature on dark networks and pointing at the relevance and policy implications of our study.
Funding
The Dutch organization “infobox Crimineel en Onverklaarbaar Vermogen” (iCOV) has provided the data and funds to conduct the research required for this paper.
Author information
Authors and Affiliations
Contributions
PG conceptualized the problem, collected the data, ran the analysis and wrote the first draft of the paper. JF restructured the paper and provided the criminological literature review. BU and MG critically assessed the arguments, reviewed the versions and provided valuable comments. All authors provided general feedback and contributed to revisions. All authors read and approved the final manuscript.
Corresponding author
Ethics declarations
Competing interests
The authors declare that they have no competing interests.
Appendix: Additional information
Appendix: Additional information
1.1 A.1 Used analysis tools
The data is retrieved from an Oracle database using Toad and PL-SQL, which is anonymized and stored in a comma-separated values format. In addition, an Microsoft Excel file is used to recode the incident codes just as the provided extract of the original criminal records database. An anonymous version of the criminal records is provided in comma-separated values format. All datasets are combined in a multitude of R [81] data frames and finally added to a large igraph [82] network structure. The appropriate nodes and edges are then filtered based on whether the node or edge exists in a given year and the resulting graphs are stored per year, upon which the analysis is performed. The libraries used are (in alphabetical order):
-
clue: Hornik K (2005). “A CLUE for CLUster Ensembles.” Journal of Statistical Software, 14(12). http://doi.org/10.18637/jss.v014.i12.
-
countrycode: Vincent Arel-Bundock (2018). “countrycode: Convert Country Names and Country Codes”. R package version 1.00.0. https://CRAN.R-project.org/package=countrycode
-
estimatr: Graeme Blair, Jasper Cooper, Alexander Coppock, Macartan Humphreys and Luke Sonnet (2018). estimatr: Fast Estimators for Design-Based Inference. R package version 0.10.0. https://CRAN.R-project.org/package=estimatr
-
extrafont: Winston Chang, (2014). “extrafont: Tools for using fonts”. R package version 0.17. https://CRAN.R-project.org/package=extrafont
-
ggplot2: H. Wickham. ggplot2: “Elegant Graphics for Data Analysis”. Springer-Verlag New York, 2016.
-
ggpubr: Alboukadel Kassambara (2018). “ggpubr: ‘ggplot2’ Based Publication Ready Plots”. R package version 0.1.7. https://CRAN.R-project.org/package=ggpubr
-
ggthemes: Jeffrey B. Arnold (2018). ggthemes: Extra Themes, Scales and Geoms for ‘ggplot2’. R package version 4.0.0. https://CRAN.R-project.org/package=ggthemes
-
gridExtra: Baptiste Auguie (2017). “gridExtra: Miscellaneous Functions for ‘Grid’ Graphics”. R package version 2.3. https://CRAN.R-project.org/package=gridExtra
-
igraph: Csardi G, Nepusz T: The igraph software package for complex network research, InterJournal, Complex Systems 1695. 2006. http://igraph.org
-
lmtest: Achim Zeileis, Torsten Hothorn (2002). “Diagnostic Checking in Regression Relationships”. R News 2(3), 7–10. https://CRAN.R-project.org/doc/Rnews/
-
plm: Croissant Y, Millo G (2008). “Panel Data Econometrics in R: The plm Package.” Journal of Statistical Software, 27(2), 1–43. http://doi.org/10.18637/jss.v027.i02and Millo G (2017). Robust Standard Error Estimators for Panel Models: A Unifying Approach. Journal of Statistical Software, 82(3), 1–27. http://doi.org/10.18637/jss.v082.i03
-
plyr: Hadley Wickham (2011). “The Split-Apply-Combine Strategy for Data Analysis”. Journal of Statistical Software, 40(1), 1–29. http://www.jstatsoft.org/v40/i01/
-
readr: Hadley Wickham, Jim Hester and Romain Francois (2017). readr: Read Rectangular Text Data. R package version 1.1.1. https://CRAN.R-project.org/package=readr
-
readxl: Hadley Wickham and Jennifer Bryan (2018). readxl: Read Excel Files. R package version 1.1.0. https://CRAN.R-project.org/package=readxl
-
sandwich: Achim Zeileis (2004). Econometric Computing with HC and HAC Covariance Matrix Estimators. Journal of Statistical Software 11(10), 1–17. http://www.jstatsoft.org/v11/i10/and Achim Zeileis (2006). Object-Oriented Computation of Sandwich Estimators. Journal of Statistical Software 16(9), 1–16. http://www.jstatsoft.org/v16/i09/
-
stargazer: Hlavac, Marek (2018). stargazer: “Well-Formatted Regression and Summary Statistics Tables”. R package version 5.2.1. https://CRAN.R-project.org/package=stargazer
-
stringr: Hadley Wickham (2018). stringr: Simple, Consistent Wrappers for Common String Operations. R package version 1.3.1. https://CRAN.R-project.org/package=stringr
-
tidyr: Hadley Wickham and Lionel Henry (2018). tidyr: Easily Tidy Data with ‘spread()’ and ‘gather()’ Functions. R package version 0.8.1. https://CRAN.R-project.org/package=tidyr
Rights and permissions
Open Access This article is licensed under a Creative Commons Attribution 4.0 International License, which permits use, sharing, adaptation, distribution and reproduction in any medium or format, as long as you give appropriate credit to the original author(s) and the source, provide a link to the Creative Commons licence, and indicate if changes were made. The images or other third party material in this article are included in the article’s Creative Commons licence, unless indicated otherwise in a credit line to the material. If material is not included in the article’s Creative Commons licence and your intended use is not permitted by statutory regulation or exceeds the permitted use, you will need to obtain permission directly from the copyright holder. To view a copy of this licence, visit http://creativecommons.org/licenses/by/4.0/.
About this article

Cite this article
Gerbrands, P., Unger, B., Getzner, M. et al. The effect of anti-money laundering policies: an empirical network analysis. EPJ Data Sci. 11, 15 (2022). https://doi.org/10.1140/epjds/s13688-022-00328-8
Received:
Accepted:
Published:
DOI: https://doi.org/10.1140/epjds/s13688-022-00328-8