- Regular article
- Open access
- Published:
Imagine a Walkable City: Physical activity and urban imageability across 19 major cities
EPJ Data Science volume 10, Article number: 56 (2021)
Abstract
Can the shape of a city promote physical activity? The question of why individuals engage in physical activity has been widely researched, but that research has predominantly focused on socio-demographic characteristics (e.g., age, gender, economic status) and coarse-grained spatial characteristics (e.g., population density), overlooking key urban characteristics of, say, whether a city is navigable or, as urban theorist Kevin Lynch put it, whether it is ‘imageable’ (whether its spatial configuration is economic of mental effort). That is mainly because, at scale, it is neither easy to model imageability nor feasible to measure physical activity. We modeled urban imageability with a single scalable metric of entropy, and then measured physical activity from 233K wearable devices over three years, and did so across 19 major cities in the developed world. We found that, after controlling for greenery, wealth, walkability, presence of landmarks, and weather conditions, the legibility hypothesis still holds: the more imageable a city, the more its dwellers engage in physical activity. Interestingly, wealth (GDP per capita) has a positive association with physical activity only in cities with inclement climate, effectively acting as a compensation mechanism for bad weather.
1 Introduction
The number of individuals who engage in physical activity is far from being satisfactory [1], emphasizing the urgent need of investigating and promoting it [2].
Traditionally, engagement in physical activity is mainly down to two types of characteristics of an individual [3, 4]. The first type has to do with an individual’s socio-demographic conditions (e.g., age, gender, weight, economic status). In the literature, activity has been consistently found to be lower among female and older individuals [5], and those differences were found to be further exacerbated in more unequal countries (i.e., those with high income inequality) [4]. The second type of characteristics has to do with the spatial characteristics the individual is likely to experience. In relation to activity, population density is one of the most widely studied spatial factor. Suburbs have been repeatedly associated with low walking rates [1], while dense presence of and closeness to services (e.g., shops) and to greenery (e.g., parks) have been associated with high rates [4]. More interestingly, denser residential areas were found to encourage walking for day-to-day transportation needs, whereas lower density neighborhoods were positively associated with walking for recreational reasons [6].
Overall, while previous work has focused on studying the impact of a wide variety of socio-demographic conditions [7, 8] and spatial characteristics [1, 4], it is unclear whether the way dwellers psychologically perceive the entire city has any association with physical activity. In the urban theory literature, such a perception is often called urban legibility or imageability. This is defined by Kevin Lynch in his seminal work “The Image of the City” [9] as the property of the built environment that helps city dwellers to form recognizable mental images of the environment, and to consequently navigate it with ease. To partly fix this literature gap, we made two sets of contributions:
-
We obtained the average number of steps (serving as a surrogate for people’s overall physical activity levels) in 19 major cities in the developed world from commercial smartwatches that 233K individuals wore between 2014 and 2017, and modeled physical activity from such a data. We then mined OpenStreetMap (OSM) data for these 19 cities, and modeled “city imageability” with a single yet principled metric based on a recently found neurological basis for Kevin Lynch’s theory of urban legibility [10]. This metric quantifies a city’s legibility using the entropy of the distribution of its streets orientations (Sect. 3).
-
We tested the legibility hypothesis, which states that the more ‘imageable’ a city is, the more its dwellers engage in physical activity. To this end, we developed a variety of linear regression models to test whether imageability is associated with physical activity (Sect. 4), while accounting for traditional predictors of activity such as wealth, presence of public greenery, weather clemency, walkability, and presence of landmarks. We found that, even after controlling for these characteristics, physical activity is higher in cities that are more “imageable” (Sect. 5), suggesting that people who reside in cities with higher recognizable areas are more likely to engage in physical activity than those who live in cities with low recognizable areas.
2 Background
2.1 Lynch’s legibility
The research history of operationalizing urban legibility is a history of designing experiments that have consistently increased in experimental scale. The concept of legibility is the central notion behind Kevin’s Lynch 1960 seminal book “The Image of the City” [9]. Lynch defined legibility as the extent to which it is easy for people to form mental images of the city, which, in turn, helps them navigate it (i.e., whether the cityscape can be ‘read’). Put differently, as people move around and engage in way-finding, they should be able to recognize and organize urban elements into a coherent pattern. Lynch posited that, for any given city, five urban qualities contribute to a city’s legibility. These qualities relate to the city’s paths (e.g., routes that allow people to move throughout the city), edges (e.g., boundaries), districts (e.g., areas characterized by common characteristics), nodes (e.g., squares or junctions that serve as focus points for orientation), and landmarks (e.g., external points of orientation). To test the role of those urban qualities, Lynch came up with experiments to extract “psychological maps” from study participants’ minds. He did so by asking each participant living in a city to draw the map of the city, and then collating all the answers into a unique psychological map. A compelling case was the city of Boston, where Lynch found that most parts of the city were unknown to its dwellers, while a handful of central areas were known to all Bostonians.
2.2 Milgram’s recognizability
A decade later, social psychologist Stalney Milgram operationalized the concept of legibility in a way that allowed for the inclusion of larger numbers of study participants. Unlike Lynch who asked participants to draw maps by hand, Milgram showed them pictures of their city, and asked them to recognize where each picture was taken. That led to the creation of recognizability maps [11, 12]. By assuming that the concept of “recognizability” is a good proxy for the concept of “legibility”, Milgram aimed at developing a collective mental map based on the places correctly recognized by the majority of the study participants and, in so doing, identifying the urban elements that made the city intelligible and recognizable.
2.3 Recognizability at scale
The advent of the Web then enabled researchers to reproduce Milgram’s recognizability experiment at a larger scale, beyond the limited and costly interview-based experiments. The ability to reach masses through web experiments showed quantitatively compelling evidence that good imageability allows city dwellers to feel at home and increase their community well-being. Using crowdsourced games, Quercia et al. [13] collected opinions of London’s scenes from thousands of people, and developed a recognizability map of the British capital. The researchers found that some of London’s boroughs have little cognitive representation, and that low recognizability was associated with poor economic indicators of income, education, and employment.
2.4 Street entropy as proxy for legibility
With the advancement of brain imaging tools (e.g., fMRI), researchers were recently able to experimentally show that the human brain, when exposed to unknown parts of a city, indexes the city using the structure of road connectivity [14]. It follows that city legibility may be directly captured through the connectivity and orientation of a city’s road network. Some researchers indeed were able to draw a concrete association between a person’s navigation capability and the road network structure [10]. They quantified the road structure using the entropy of the distribution of street orientations, and found that a city’s street entropy was positively associated with the navigation abilities of its dwellers. The entropy metric turns out to compactly capture street orientations, as Fig. 1 shows for London vs. New York: a high-entropic city such as London exhibits a mix of densely packed roads and isotropic road orientations, whereas New York exhibits preferential orientations towards the North-South and East-West directions. Based on the scaling hypothesis of linear perception [10], the urban form captured by the entropy metric is strongly related to imageability: intuitively, the more entropic a space is, the more turns it has, the higher the ability to mentally chunk it, the more economical of mental effort its imageability. As such, we set out to operationalize legibility with the entropy metric.

Examples of street networks in London and New York, and the corresponding polar histograms. Each city’s street network refers to the square of 1 km2 centered in the city’s geographic centroid. Upon that square, the value of street entropy was computed. London’s street orientations have higher entropy (\(H=3.56\)) than those in New York (\(H=1.98\))
3 Datasets and metrics
We now describe the data used to develop the metrics for our analyses.
3.1 Smartwatches logs
As consumer-grade wearables are now fully equipped with body sensors, it is possible to measure people’s well-being (e.g., physical activity or emotional states) at an individual [15], or at a collective level [16]. We obtained activity data from commercial smartwatches worn by 232,707 unique users (55% male with 42 years as the median age) between 2014 and 2017 across 19 major cities in the developed world (Fig. 2a). Physical activity data was aggregated at the level of the entire city, thus neither individual nor geo-referenced neighborhood data was available. The 19 cities belong to parts of the world that have enjoyed high penetration rates of wearable devices over the recent years [17]. Yet, there are still differences in adoption rates across these cities. That is why we chose to measure the number of steps per capita to capture actual physical activity rather than device adoption. We have to stress, however, that our data does not represent a stratified sample of a city’s inhabitants. Our users represent high-end consumers who are likely to enjoy specific lifestyles and to live in specific (central) parts of a city. Specifically, we obtained the average number of daily steps per capita in each city (Fig. 2b) over the course of three years (\(\min = 5376.44\), \(\max = 7099.73\), \(\mu = 6446.96\), \(\sigma = 425.27\)). For example, the average step counts shows that, in our users’ sample, our users in London were more physically active, on average, than those in Houston. The 19 cities span across three continents, and include the likes of Tokyo (TYO), New York (NYC), Los Angeles (LAX), Paris (PAR), London (LON), Chicago (CHI), Madrid (MAD), Houston (HOU), Toronto (YTO), Berlin (BER), San Francisco (SFO), Vienna (VIE), Hamburg (HAM), Munich (MUC), Stockholm (STO), Helsinki (HEL), Frankfurt (FRA), Dusseldorf (DUS), and Zurich (ZRH).

(a) Number of users of our smartwatches; and (b) Average number of daily steps per capita (which is our physical activity metric) across the 19 cities (average computed across the whole period, from 2014 to 2017)
3.2 Data ethics of smartwatches logs
The data processing in this study is compliant with the smartwatch company’s terms and conditions. Additionally, in accordance with the General Data Protection Regulation (GDPR), no researcher involved in the study could have tracked the identity of any user by any means, and all readings were obtained and analyzed at an aggregated level.
3.3 Urban characteristics
Next, we describe the predictors of physical activity we included in our analyses.
-
lnGDP: The gross domestic product (GDP) is a common socio-economic factor that reflects an area’s wealth. For each city, we collected the GDP per capita from the Organization for Economic Co-operation and Development (OECD) regional statistics, and log-transformed it using the natural logarithm (
 ) due to its skewed distribution (\(\min = 11.31\), \(\max = 14.37\), \(\mu = 12.73\), \(\sigma = 0.94\)).
 -
Clemency: We collected each city’s daily temperature from the National Climatic Data Center. We averaged the daily values for the period between 2014 and 2017, and obtained the average temperature temp for each city. To account for how humans experience ambient temperature, in line with previous work [18], we adjusted temp by computing a ‘clemency temperature variable’ (
 ) as: \(-| \mathit{temp} - 22 \text{C}^{\circ} | \) (\(\min = -15.57\), \(\max = -0.53\), \(\mu = -9.72\), \(\sigma = 3.64\)). The clemency temperature variable captures the extent to which a city’s ambient temperature is close to the psycho-physiological comfort optimum of 22C°. The closer a city’s temperature to the optimum is, the more clement its climate is.
 -
Greenery: From data taken from two online portals - the World Cities Culture Forum, and the EU’s regional and urban development - we computed the percentage of public green areas (including those on the streets) over the city’s total area (\(\min = 7.5\), \(\max = 50\), \(\mu = 26.08\), \(\sigma = 13.39\)). The higher its value, the more public greenery the city has (
 ), the healthier the city’s population is expected to be [19].
 -
Street entropy: Using the OSMnx toolbox [20], we downloaded the street network topology of the 19 cities from OSM, and computed a metric that has been shown to capture city imageability [10]. We first created a street network graph for each city from the 1 km2 square centered in the city’s geographical centroid. We chose this sampling to make our results comparable with previous work on street entropy [10], and kept the very same sampling across all cities to make our results comparable. We then computed a 36-bin edge bearings distribution (1 bin every 10 degrees) by taking one value per street segment. We initially took twice as many bins as desired, then merged them in pairs to prevent bin-edge effects around common values like 0 and 90 degrees. We also moved the last bin to the front; i.e., 0.01 degree and 359.99 degrees were binned together. We calculated the Shannon entropy of the city’s orientations’ distribution:
$$ H = - \sum_{i=1}^{36} P(o_{i})\log \bigl(P(o_{i}) \bigr), $$(1)where i indexes the bins, and \(P(o_{i})\) represents the proportion of orientations that fall into the ith bin [21]. Figure 3 depicts the street network orientation (\(\min = 1.98\), \(\max = 3.57\), \(\mu = 3.21\), \(\sigma = 0.46\)) of high-entropic cities (e.g., Helsinki, London) and low-entropic ones (e.g., Hamburg, New York).
Figure 3 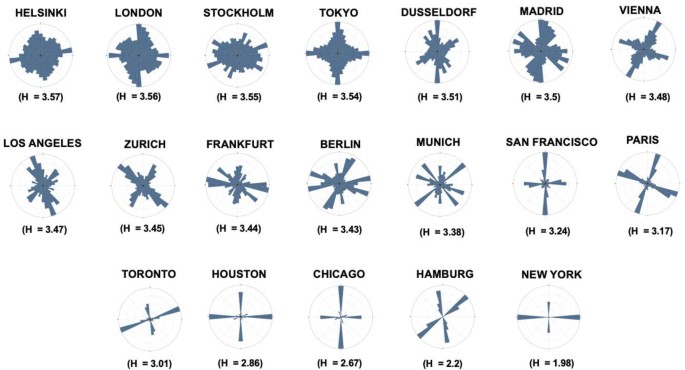
Polar histograms reflecting street orientations in high-entropic cities (top), and in low-entropic ones (bottom). Each histogram comes with the corresponding value of street entropy computed with equation (1)
Figure 4 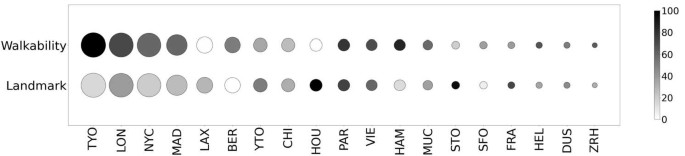
Bubble chart showing the presence of walkable elements and landmarks in our cities. Cities are ordered by decreasing population size (bubble size). The shades of the bubbles capture the fraction of scenes containing urban elements that contribute to walkability, and the fraction of scenes that contain landmarks. Tokyo and London have the highest fraction of scenes in the walkability category, while Paris and Stockholm have the highest fraction of scenes in the landmarks category. Both categories - especially when seen in combination - have been found to foster physical activity
-
Walkability and Landmarks: Specific urban elements (e.g., small streets, absence of cars) have been shown to contribute to physical activity [22–24]. To capture the presence of these elements, we processed street scenes from the crowd-sourced mapping platform of Mapillary. Its users automatically upload street scenes they previously captured with personal cameras, typically GoPros or mobile phone cameras. We selected all the scenes within the square of 1 km2 centered in the city’s geographical center and, to avoid repetitions, we selected one scene per location by taking the most recent one based on the timestamps. We then classified the collected 800,000 Mapillary scenes with an algorithm called PlacesNet [25]. This classifies a scene into 205 outdoor scene types. We arranged these types into two categories based on a previously developed taxonomy [24] grounded on the urban design literature [9, 26, 27]. The first category is the walkability category, and contains types contributing to physical activity (e.g., pavilion, plaza, boardwalk, alley). The second is the landmarks category, and contains types that reflect the presence of landmarks (e.g., bridge, arch, church), which has also been found to contribute to physical activity. We finally computed the fraction of scenes containing elements in the walkability category (over all the scenes), and the fraction of scenes containing elements in the landmarks category. We have to stress that these two categories are not orthogonal, but their combination is what matters: if they are both present in a space, then that space is likely to be conducive to physical activity. Plazas are classified under the category ‘walkability’ because, in the literature, they are typically seen as urban elements that foster pedestrian activity [26]. Yet, landmarks contribute to physical activity too simply by being spatial markers essential for wayfinding.
 ) due to its skewed distribution (
 ) as:
) as:  ), the healthier the city’s population is expected to be [

4 Analysis
To test the legibility hypothesis [9] and, specifically, whether the street entropy is a good predictor of physical activity, we developed four main linear regression models (Table 3), which controlled for traditional proxies for physical activity.
Before developing our regression models, we examined the cross-correlation matrix (Table 2) between our independent variables (i.e., lnGDP, clemency, greenery, street entropy, walkability, and landmarks), and the dependent variable (i.e., physical activity). We found that lnGDP and clemency were highly correlated (\(r=0.60\), \(p < .001\)), and so were lnGDP and greenery (\(r=-0.50\), \(p < .005\)), thus we introduced their interaction terms as the product of each pair. The remaining correlations were weak, thus no additional interaction effect had to be accounted for. To produce comparable results, using a z-score transformation (\(\frac{x - \mu _{x}}{\sigma _{x}}\)), we standardized our dependent variable of physical activity, the street entropy metric, and the greenery metric. On the other hand, we kept the original units for lnGDP, clemency, and the fractions of scenes being classified as walkability/landmarks as their values were normally distributed.
5 Results
Table 3 reports the four linear regressions, which predicted physical activity (i.e., average number of daily steps per capita) from our predictors, in various combinations. As seen in Fig. 5, our best performing model \(M_{IG+E+W+L}\)—the model with lnGDP (lG), Street Entropy (E), Walkability (W), and Landmarks (L)—explains 52% of the variance in the data. A model with lnGDP and Clemency as predictors performs less well (\(\mathit{Adj} R^{2}= 0.12\)), while \(M_{IG+C}\)’s improved only slightly when also taking into account the interaction between these two predictors (\(\mathit{Adj} R^{2}= 0.14\)). To test whether the structural differences between European cities and non-EU cities impacted physical activity, we considered a dummy variable EU (which is 1, if the city is in EU; or is 0 otherwise), added it to baseline model \(M_{IG+C}\), and indeed observed that its \(\mathit{Adj} R^{2}\) increased from 0.14 to 0.26. This suggested that these structrual differences did play a role. When adding Street Entropy, the variance explained was as high as \(\mathit{Adj} R^{2}= 0.37\) (\(M_{IG+C+E+G}\)). However, Greenery did not show any explanatory power, suggesting that the city’s public greenery taken in its entirety was not associated with physical activity. After removing public greenery from our final \(M_{IG+C+E}\) model, we obtained a better fit for our data (i.e., \(\mathit{Adj} R^{2}= 0.46\)). Finally, when adding the Walkability and Landmark metrics to that model, and running stepAIC [28], which selected the least number of predictors having an overall best fit, we obtained an \(\mathit{Adj} R^{2}\) of 0.52. By then adding dummy variable EU to our best performing model \(M_{IG+E+W+L}\), its \(\mathit{Adj} R^{2}\) did not change, suggesting that EU was partly capturing Street Entropy in \(M_{IG+C}\) but ceased to be of importance once Street Entropy was added as a predictor. In other words, Street Entropy not only fully captured the structural differences between European cities and non-EU cities but, compared to the dichotomous variable EU, it was a better predictor of physical activity. By inspecting \(M_{IG+E+W+L}\)’s predictors, we observed that Street Entropy (\(p = .009\)) and the interaction term between lnGDP and Clemency (\(p = .02\)) were still significant, and that physical activity was: (i) positively associated with Street Entropy (\(\beta _{\textrm{Street Entropy}} = 0.57\)); and (ii) negatively associated with the interaction between lnGDP and Clemency (\(\beta _{\textrm{(lnGDPxClemency)}} = -0.97\)). The former result translates into saying that there is higher physical activity in cities whose streets orientations are highly entropic: a change of 1 standard deviation in street entropy leads to a 0.6 standard deviation increase in physical activity; a finding that confirms the legibility hypothesis—physical activity is higher in cities that are more “imageable”. To interpret the latter result instead, we shall take into account that lnGDP and Clemency interact with each other resulting in the extra impact of wealth on activity to the following extent: \(\beta _{\textrm{(lnGDPxClemency)}} = -0.97\). So for a city whose Clemency is −5 (e.g., five degrees below/above the optimum temperature of 22 C°), the extra positive impact of wealth is 4.85xlnGDP for every unit increase in lnGDP; by contrast, for a city whose Clemency is −10 (e.g., ten degrees below/above the optimum), the extra positive impact of wealth is as high as 9.7xlnGDP for every unit increase in lnGDP. In plain English, this means that, the more inclement the weather, the more positive the effect of increasing wealth on physical activity. Put differently, to attain the same levels of physical activity in one city with far worse temperature than another city’s, the former city needs to compensate its worst weather with higher levels of wealth. Therefore, GDP matters for physical activity not so much for cities with good climate (\(\beta _{\textrm{lnGDP}}=-0.58\), for Clemency = 0), but more for cities with inclement weather, having a compensatory effect. While Walkability and Landmarks explain an additional 6% of variance in the data (\(M_{IG+E+W+L}\)), their coefficients were not statistically significant, likely because of the limited number of cities. However, these two metrics were highly correlated with our dependent variable (Table 2), suggesting sufficient explanatory power even if considered individually. By fitting an additional regression model that adds these two metrics to our \(M_{IG+C}\) baseline model, we indeed observed an additional 4% of explained variance.

Adjusted \(R^{2}\) values of the four regressions with different predictors: IG: lnGDP; C: Clemency; E: street Entropy; G: Greenery; W: Walkability; and L: Landmark
6 Discussion
We have shown that street entropy is strongly associated with physical activity. Even after controlling for a city’s wealth and climate, street entropy has more explanatory power than greenery’s. One might speculate that presence of greenery does not necessarily translate into its use [29] (e.g., private green areas are present but not accessible), while street entropy is a concept closer to actual walkability. Interestingly, our findings suggest that a city’s wealth has little explanatory power in general, yet, wherever needed, it compensates for the detrimental impact of inclement weather.
Our work has both theoretical and practical implications. From a theoretical standpoint, the results confirm previous findings in the neurology of legibility, that is, in the ways our brains are wired to perceive spatial layouts [10, 14]. Furthermore, our street entropy metric offers an alternative way of capturing city’s imageability, which may be adopted by future urban computing studies to investigate the relationship between rich representations of the spatial layout - beyond the typical analyses of POIs - and societal outcomes (e.g., economic activity, dwellers’ sleep behavior), expanding the current literature that has already linked regular physical activity to improved creativity [30] and mental health [31]. From a practical standpoint, our findings might well serve as a “call for action” in public health: campaigns or intervention programs could target parts of a city that are less naturally conducive to physical activity.
Our work has limitations that call for future research. First, our findings hold for our 19 cities in developed countries, and may not be generalized to more socio-economically deprived countries. In a similar vein, our results hold for individuals who wear high-end tracking devices and, as such, are likely to be tech-savvy and health-conscious. That is why our sampling method of street scenes focused on city centers where our user demographic is likely to live. Yet, despite the homogeneous set of individuals across the cities, it is interesting to observe stark differences in physical activity, which the legibility hypothesis explained to a great extent. As commercial wearables will be widely adopted, analyses similar to ours could be repeated for a larger number of cities, or even for the entire globe, both boosting the statistical significance of our existing results and allowing for cross-cultural comparisons. Secondly, with sets of data more fine-grained than ours (e.g., data at the level of individuals, data geo-referenced at the level of neighborhoods), researchers could focus on important within-city and within-subject similarities and differences, which could not be explored with our aggregate data.
Availability of data and materials
The aggregated data from Mapillary, and urban characteristics (i.e., GDP, clemency, greenery, and street entropy) will be made publicly available.
Abbreviations
- OSM:
-
open street map
- GDPR:
-
general data protection regulation
- GDP:
-
gross domestric product
- OECD:
-
organizatioon for economic co-operation and development
- TYO:
-
Tokyo
- NYC:
-
New York
- LAX:
-
Los Angeles
- PAR:
-
Paris
- LON:
-
London
- CHI:
-
Chicago
- MAD:
-
Madrid
- HOU:
-
Houston
- YTO:
-
Toronto
- BER:
-
Berlin
- SFO:
-
San Francisco
- VIE:
-
Vienna
- HAM:
-
Hamburg
- MUC:
-
Munich
- STO:
-
Stockholm
- HEL:
-
Helsinki
- FRA:
-
Frankfurt
- DUS:
-
Dusseldorf
- ZRH:
-
Zurich.
References
Brownson RC, Boehmer TK, Luke DA (2005) Declining rates of physical activity in the United States: what are the contributors? Annual Reviews Public Health 26:421–443
Dzewaltowski DA, Estabrooks PA, Glasgow RE (2004) The future of physical activity behavior change research: what is needed to improve translation of research into health promotion practice? Exerc Sport Sci Rev 32(2):57–63
Booth SL, Sallis JF, Ritenbaugh C, Hill JO, Birch LL, Frank LD, Glanz K, Himmelgreen DA, Mudd M, Popkin BM et al. (2001) Environmental and societal factors affect food choice and physical activity: rationale, influences, and leverage points. Nutr Rev 59(3):21–36
Althoff T, Hicks JL, King AC, Delp SL, Leskovec J et al. (2017) Large-scale physical activity data reveal worldwide activity inequality. Nature 547(7663):336–339
Belcher BR, Berrigan D, Dodd KW, Emken BA, Chou C-P, Spuijt-Metz D (2010) Physical activity in us youth: impact of race/ethnicity, age, gender, & weight status. Med Sci Sports Exerc 42(12):2211
Gao J, Kamphuis CB, Helbich M, Ettema D (2020) What is ‘neighborhood walkability’? How the built environment differently correlates with walking for different purposes and with walking on weekdays and weekends. J Transp Geogr 88:102860
Liao Y, Shonkoff ET, Dunton GF (2015) The acute relationships between affect, physical feeling states, and physical activity in daily life: a review of current evidence. Front Psychol 6:1975
Shameli A, Althoff T, Saberi A, Leskovec J (2017) How gamification affects physical activity: large-scale analysis of walking challenges in a mobile application. In: Proceedings of the ACM international conference on world wide web (WWW) companion, pp 455–463
Lynch K (1960) The image of the city. MIT Press, Cambridge
Coutrot A, Manley E, Yesiltepe D, Dalton RC, Wiener JM, Holscher C, Hornberger M, Spiers HJ (2020) Cities have a negative impact on navigation ability: evidence from 38 countries. Biorxiv
Milgram S, Sabini JE, Silver ME (1992) The individual in a social world: essays and experiments. McGraw-Hill, New York
Milgram S (1992) Psychological maps of paris. The Individual in a Social World, 88–113
Quercia D, Pesce JP, Almeida V, Crowcroft J (2013) Psychological maps 2.0: a web engagement enterprise starting in London. In: Proceedings of the ACM international conference on world wide web (WWW), pp 1065–1076
Javadi A-H, Emo B, Howard LR, Zisch FE, Yu Y, Knight R, Silva JP, Spiers HJ (2017) Hippocampal and prefrontal processing of network topology to simulate the future. Nat Commun 8(1):1–11
Park S, Constantinides M, Aiello LM, Quercia D, Van Gent P (2020) Wellbeat: a framework for tracking daily well-being using smartwatches. IEEE Internet Comput 24(5):10–17
Aiello LM, Quercia D, Roitmann E (2018) Hearts and politics: metrics for tracking biorhythm changes during brexit and trump. In: Proceedings of the ACM international conference on digital health, pp 111–115
Statista: Number of connected wearable devices worldwide by region from 2015 to 2022 (2021). https://www.statista.com/statistics/490231/wearable-devices-worldwide-by-region/
Wei W, Lu JG, Galinsky AD, Wu H, Gosling SD, Rentfrow PJ, Yuan W, Zhang Q, Guo Y, Zhang M et al. (2017) Regional ambient temperature is associated with human personality. Nat Hum Behav 1(12):890–895
Mytton OT, Townsend N, Rutter H, Foster C (2012) Green space and physical activity: an observational study using health survey for England data. Health Place 18(5):1034–1041
Boeing G (2017) Osmnx: New methods for acquiring, constructing, analyzing, and visualizing complex street networks. Comput Environ Urban Syst 65:126–139
Boeing G (2020) A multi-scale analysis of 27,000 urban street networks: every us city, town, urbanized area, and zillow neighborhood. Environment and Planning B: Urban Analytics and City Science 47(4):590–608
Yin L (2017) Street level urban design qualities for walkability: combining 2d and 3d gis measures. Comput Environ Urban Syst 64:288–296
Koo BW, Guhathakurta S, Botchwey N (2021) How are neighborhood and street-level walkability factors associated with walking behaviors? a big data approach using street view images. Environment and Behavior 00139165211014609
Joglekar S, Quercia D, Redi M, Aiello LM, Kauer T, Sastry N (2020) Facelift: a transparent deep learning framework to beautify urban scenes. R Soc Open Sci 7(1):190987
Zhou B, Lapedriza A, Xiao J, Torralba A, Oliva A (2014) Learning deep features for scene recognition using places database
Ewing RH, Clemente O, Neckerman KM, Purciel-Hill M, Quinn JW, Rundle A (2013) Measuring urban design: metrics for livable places. Springer, Berlin
Quercia D, O’Hare NK, Cramer H (2014) Aesthetic capital: what makes London look beautiful, quiet, and happy? In: Proceedings of the 17th ACM conference on computer supported cooperative work & social computing, pp 945–955
Zhang Z (2016) Variable selection with stepwise and best subset approaches. Annals of translational medicine 4(7)
Ye Y, Richards D, Lu Y, Song X, Zhuang Y, Zeng W, Zhong T (2019) Measuring daily accessed street greenery: a human-scale approach for informing better urban planning practices. Landsc Urban Plan 191:103434
Rominger C, Fink A, Weber B, Papousek I, Schwerdtfeger AR (2020) Everyday bodily movement is associated with creativity independently from active positive affect: a Bayesian mediation analysis approach. Sci Rep 10(1):1–9
Choi KW, Chen C-Y, Stein MB, Klimentidis YC, Wang M-J, Koenen KC, Smoller JW et al. (2019) Assessment of bidirectional relationships between physical activity and depression among adults: a 2-sample Mendelian randomization study. JAMA Psychiatr 76(4):399–408
Acknowledgements
The authors thank Ke Zhou for providing useful feedback.
Funding
Nokia Bell Labs provided support in the form of salaries for authors [MC, SJ, SS, DQ], but did not have any additional role in the study design, data collection and analysis, decision to publish, or preparation of the manuscript. The specific roles of these authors are articulated in the ‘author contributions’ section.
Author information
Authors and Affiliations
Contributions
MC and SJ collected the data and conducted the analysis. MC, SJ, SS, and DQ conceived the experiments and wrote the manuscript. All authors read and approved the final manuscript.
Corresponding author
Ethics declarations
Competing interests
The authors declare that they have no competing interests.
Rights and permissions
Open Access This article is licensed under a Creative Commons Attribution 4.0 International License, which permits use, sharing, adaptation, distribution and reproduction in any medium or format, as long as you give appropriate credit to the original author(s) and the source, provide a link to the Creative Commons licence, and indicate if changes were made. The images or other third party material in this article are included in the article’s Creative Commons licence, unless indicated otherwise in a credit line to the material. If material is not included in the article’s Creative Commons licence and your intended use is not permitted by statutory regulation or exceeds the permitted use, you will need to obtain permission directly from the copyright holder. To view a copy of this licence, visit http://creativecommons.org/licenses/by/4.0/.
About this article

Cite this article
Constantinides, M., Joglekar, S., Šćepanović, S. et al. Imagine a Walkable City: Physical activity and urban imageability across 19 major cities. EPJ Data Sci. 10, 56 (2021). https://doi.org/10.1140/epjds/s13688-021-00313-7
Received:
Accepted:
Published:
DOI: https://doi.org/10.1140/epjds/s13688-021-00313-7